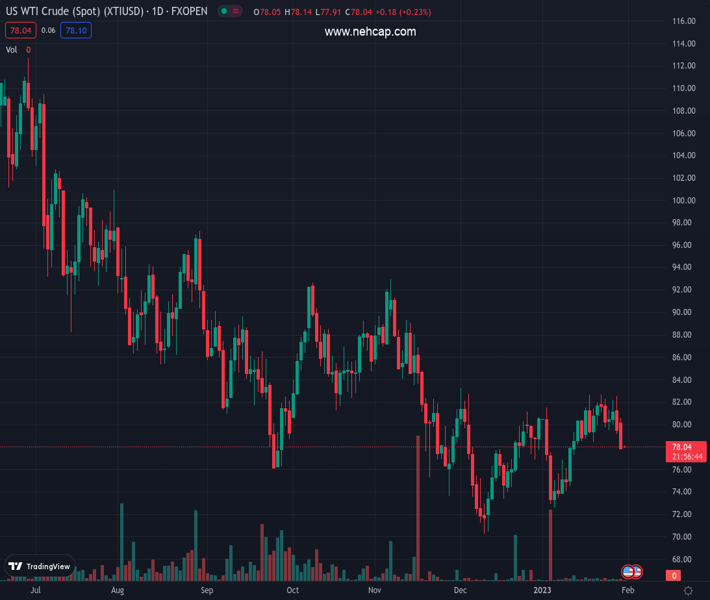
Oil price has shifted its business below $78.00 as western central banks stare a fresh rate hike. (Pivot Orderbook analysis)
…
This is a premium post.
[s2If !current_user_can(access_s2member_level4)]Please register for PREMIUM VERSION HERE to read full post below containing analysis. In case of any error or you think you are not able to read the full post below, please email us at support#nehcap.com [lwa][/s2If] [s2If current_user_can(access_s2member_level4)]
- Oil price has shifted its business below $78.00 as western central banks stare a fresh rate hike.
- The continuation of hawkish monetary policy by the central banks might advance global recession fears.
- China’s Caixin Manufacturing PMI might remain upbeat as the economy is now operating at full capacity levels.
The pair currently trades last at 78.15.
The previous day high was 82.56 while the previous day low was 79.15. The daily 38.2% Fib levels comes at 80.45, expected to provide resistance. Similarly, the daily 61.8% fib level is at 81.26, expected to provide resistance.
West Texas Intermediate (WTI), futures on NYMEX, have shifted their auction below the crucial support of $78.00 in the early Asian session. On Monday, the oil price extends its losses after failing to hold the psychological resistance of $80.00. Rising fears of a global recession as western central banks are expected to hike their interest rates further have weakened oil demand projections dramatically.
Various developed economies have been demonstrating contraction in the scale of economic activities as western central banks are on a mission to tame soaring inflation in achieving price stability.
Starting from the mighty Federal Reserve (Fed) which is expected to hike interest rates by 25 basis points (bps) to the 4.50-4.75% range to the European Central Bank (ECB), which is worried about rising wages is likely to push interest rates by 50 bps to 2.50%. And, last, the Bank of England (BoE) which is struggling to ease the double-digit inflation figure in the United Kingdom economy might follow the footprints of the ECB ahead and will accelerate global recession fears after continuing their interest rates hiking sage of CY2022 this year.
Apart from that, investors will also look toward the release of the Caixin Manufacturing PMI data, which is scheduled for Wednesday. The economic data is expected to expand to 49.5 from the former release of 49.0 as the Chinese economy is open for operating at full capacity after remaining locked due to pandemic controls. It is worth noting that China is the largest importer of oil and accelerating manufacturing activities in that region might express optimism for the oil price.
On the supply front, oil flows from Russia are advancing despite sanctions from the western cartel after its invasion of Ukraine. Earlier, the oil price was rising on expectations that Russia might not be ready in delivering oil at deeply discounted prices. However, Moscow’s oil outflows have risen, which has trimmed supply worries firmly.
Technical Levels: Supports and Resistances
XTIUSD currently trading at 78.15 at the time of writing. Pair opened at 79.53 and is trading with a change of -1.74 % .
| Overview | Overview.1 | |
|---|---|---|
| 0 | Today last price | 78.15 |
| 1 | Today Daily Change | -1.38 |
| 2 | Today Daily Change % | -1.74 |
| 3 | Today daily open | 79.53 |
The pair is trading below its 20 Daily moving average @ 78.58, above its 50 Daily moving average @ 77.84 , below its 100 Daily moving average @ 81.61 and below its 200 Daily moving average @ 91.4
| Trends | Trends.1 | |
|---|---|---|
| 0 | Daily SMA20 | 78.58 |
| 1 | Daily SMA50 | 77.84 |
| 2 | Daily SMA100 | 81.61 |
| 3 | Daily SMA200 | 91.40 |
The previous day high was 82.56 while the previous day low was 79.15. The daily 38.2% Fib levels comes at 80.45, expected to provide resistance. Similarly, the daily 61.8% fib level is at 81.26, expected to provide resistance.
Note the levels of interest below:
- Pivot support is noted at 78.27, 77.01, 74.87
- Pivot resistance is noted at 81.68, 83.82, 85.08
| Levels | Levels.1 |
|---|---|
| Previous Daily High | 82.56 |
| Previous Daily Low | 79.15 |
| Previous Weekly High | 82.68 |
| Previous Weekly Low | 79.15 |
| Previous Monthly High | 83.30 |
| Previous Monthly Low | 70.27 |
| Daily Fibonacci 38.2% | 80.45 |
| Daily Fibonacci 61.8% | 81.26 |
| Daily Pivot Point S1 | 78.27 |
| Daily Pivot Point S2 | 77.01 |
| Daily Pivot Point S3 | 74.87 |
| Daily Pivot Point R1 | 81.68 |
| Daily Pivot Point R2 | 83.82 |
| Daily Pivot Point R3 | 85.08 |
[/s2If]
Join Our Telegram Group
")


