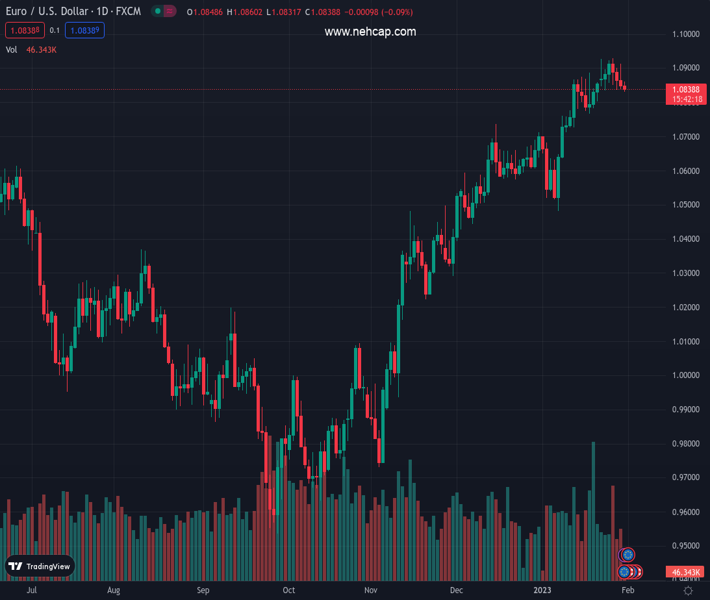
#EURUSD @ 1.08377 takes offers to refresh intraday low as bears tighten the grip., @nehcap view: Further downside expected (Pivot Orderbook analysis)
…
This is a premium post.
[s2If !current_user_can(access_s2member_level4)]Please register for PREMIUM VERSION HERE to read full post below containing analysis. In case of any error or you think you are not able to read the full post below, please email us at support#nehcap.com [lwa][/s2If] [s2If current_user_can(access_s2member_level4)]
- EUR/USD takes offers to refresh intraday low as bears tighten the grip.
- A clear break of three-week-old ascending trend line, sustained trading below 200-HMA favor sellers.
- Bearish MACD signals add strength to the downside bias.
- Buyers need to cross the 1.0930 hurdle to retake control.
The pair currently trades last at 1.08377.
The previous day high was 1.0914 while the previous day low was 1.0839. The daily 38.2% Fib levels comes at 1.0868, expected to provide resistance. Similarly, the daily 61.8% fib level is at 1.0885, expected to provide resistance.
EUR/USD slides to a one-week low while taking offers around 1.0830 during the early hours of Tuesday morning in Europe.
In doing so, the major currency pair declines for the fourth consecutive day while reversing late Monday’s corrective bounce off 1.0838. Also keeping the EUR/USD bears hopeful are the bearish MACD signals and the clear downside break of the three-week-old support line, not to forget sustained trading below the 200-Hour Moving Average (HMA).
As a result, the quote is well-set to approach the 1.0800 round figure before hitting the 61.8% Fibonacci retracement level of January 10-26 upside, close to 1.0795.
In a case where the EUR/USD price fails to rebound from the key Fibonacci retracement level, also known as the golden ratio, the bears won’t hesitate to challenge the early January swing low near 1.0710.
On the flip side, the aforementioned support-turned-resistance and the 200-HMA could challenge the EUR/USD recovery, respectively near 1.0850 and 1.0865.
Following that, multiple resistances near 1.0900 could challenge the EUR/USD rebound before highlighting the monthly top near 1.0930.
If the pair buyers keep the reins past 1.0930, the odds of witnessing 1.1000 on the chart can’t be ruled out.
Trend: Further downside expected
Technical Levels: Supports and Resistances
EURUSD currently trading at 1.0835 at the time of writing. Pair opened at 1.0846 and is trading with a change of -0.10% % .
| Overview | Overview.1 | |
|---|---|---|
| 0 | Today last price | 1.0835 |
| 1 | Today Daily Change | -0.0011 |
| 2 | Today Daily Change % | -0.10% |
| 3 | Today daily open | 1.0846 |
The pair remains strongly bullish on the daily timeframe. It trades above its 20 SMA @ 1.0779, 50 SMA 1.0636, 100 SMA @ 1.0284 and 200 SMA @ 1.0312.
| Trends | Trends.1 | |
|---|---|---|
| 0 | Daily SMA20 | 1.0779 |
| 1 | Daily SMA50 | 1.0636 |
| 2 | Daily SMA100 | 1.0284 |
| 3 | Daily SMA200 | 1.0312 |
The previous day high was 1.0914 while the previous day low was 1.0839. The daily 38.2% Fib levels comes at 1.0868, expected to provide resistance. Similarly, the daily 61.8% fib level is at 1.0885, expected to provide resistance.
Note the levels of interest below:
- Pivot support is noted at 1.0819, 1.0792, 1.0744
- Pivot resistance is noted at 1.0893, 1.0941, 1.0968
| Levels | Levels.1 |
|---|---|
| Previous Daily High | 1.0914 |
| Previous Daily Low | 1.0839 |
| Previous Weekly High | 1.0930 |
| Previous Weekly Low | 1.0835 |
| Previous Monthly High | 1.0736 |
| Previous Monthly Low | 1.0393 |
| Daily Fibonacci 38.2% | 1.0868 |
| Daily Fibonacci 61.8% | 1.0885 |
| Daily Pivot Point S1 | 1.0819 |
| Daily Pivot Point S2 | 1.0792 |
| Daily Pivot Point S3 | 1.0744 |
| Daily Pivot Point R1 | 1.0893 |
| Daily Pivot Point R2 | 1.0941 |
| Daily Pivot Point R3 | 1.0968 |
[/s2If]
Join Our Telegram Group
")


