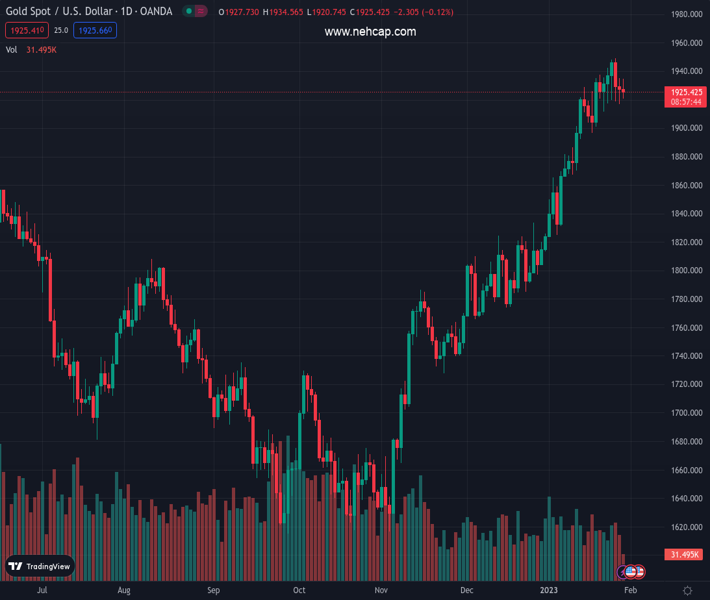
#XAUUSD @ 1,926.17 Gold price oscillates in a narrow range and is influenced by a combination of diverging forces. (Pivot Orderbook analysis)
…
This is a premium post.
[s2If !current_user_can(access_s2member_level4)]Please register for PREMIUM VERSION HERE to read full post below containing analysis. In case of any error or you think you are not able to read the full post below, please email us at support#nehcap.com [lwa][/s2If] [s2If current_user_can(access_s2member_level4)]
- Gold price oscillates in a narrow range and is influenced by a combination of diverging forces.
- Bets for smaller rate hikes by the Federal Reserve undermine the US Dollar and lend support.
- Looming recession risks weigh on investors’ sentiment and also contribute to limiting losses.
- Rising US Treasury bond yields act as a headwind ahead of this week’s central bank meetings.
The pair currently trades last at 1926.17.
The previous day high was 1935.1 while the previous day low was 1916.73. The daily 38.2% Fib levels comes at 1923.75, expected to provide support. Similarly, the daily 61.8% fib level is at 1928.08, expected to provide resistance.
Gold price kicks off the new week on a subdued note and oscillates in a narrow trading band through the mid-European session. Currently placed around the $1,925 region, the XAU/USD remains confined within Friday’s trading range as investors await this week’s key central bank event risks before placing fresh directional bets.
The Federal Reserve (Fed) will announce its decision at the end of a two-day monetary policy meeting on Wednesday. The markets have been pricing in a greater chance of a 25 basis points (bps) rate hike amid signs of easing inflationary pressures in the United States (US). The bets were lifted by the release of the US Core Personal Consumption Expenditures (PCE) Price Index, which decelerated to the 4.4% YoY rate in December from the 4.7% previous. This, in turn, keeps the US Dollar (USD) bulls on the defensive near a multi-month low and lends some support to the Gold price.
That said, the US fourth quarter Gross Domestic Product (GDP) print released last week pointed to a resilient economy, which could allow the Fed to stick to its hawkish stance for longer. This triggers a fresh leg up in the US Treasury bond yields and keeps a lid on the non-yielding Gold price. Hence, investors will look for clues about the Fed’s future rate hikes. Apart from this, the focus will be on the European Central Bank (ECB) and the Bank of England (BoE) policy meetings on Thursday. This, in turn, will play a key role in determining the near-term trajectory for the XAU/USD.
In the meantime, the prevalent risk-off environment – as depicted by a generally weaker tone around the equity markets – should act as a tailwind for the safe-haven Gold price. The worst yet COVID-19 outbreak in China raised uncertainty over a strong economic recovery and tempers investors’ appetite for riskier assets. This, along with the protracted Russia-Ukraine war, has been fueling recession fears and taking its toll on the global risk sentiment. Hence, any subsequent dip in Gold price could be seen as a buying opportunity and is more likely to remain limited, at least for now.
From a technical perspective, Friday’s swing low, around the $1,917-$1,916 area, now seems to protect the immediate downside. Any further decline is likely to attract fresh buyers near the $1,900 round figure, which should act as a pivotal point. A convincing break below might shift the near-term bias in favour of bearish traders and pave the way for a meaningful corrective pullback.
On the flip side, immediate strong resistance is pegged near the $1,949 area, or a multi-month top touched last Thursday. Some follow-through buying will be seen as a fresh trigger for bulls and lift the Gold price to the $1,969-$1,970 region. The momentum could get extended further, allowing the XAU/USD bulls to surpass an intermediate hurdle near the $1,980 zone and reclaim the $2,000 psychological mark for the first time since March 2022.
Technical Levels: Supports and Resistances
XAUUSD currently trading at 1925.95 at the time of writing. Pair opened at 1926.68 and is trading with a change of -0.04 % .
| Overview | Overview.1 | |
|---|---|---|
| 0 | Today last price | 1925.95 |
| 1 | Today Daily Change | -0.73 |
| 2 | Today Daily Change % | -0.04 |
| 3 | Today daily open | 1926.68 |
The pair remains strongly bullish on the daily timeframe. It trades above its 20 SMA @ 1896.14, 50 SMA 1829.25, 100 SMA @ 1755.29 and 200 SMA @ 1775.48.
| Trends | Trends.1 | |
|---|---|---|
| 0 | Daily SMA20 | 1896.14 |
| 1 | Daily SMA50 | 1829.25 |
| 2 | Daily SMA100 | 1755.29 |
| 3 | Daily SMA200 | 1775.48 |
The previous day high was 1935.1 while the previous day low was 1916.73. The daily 38.2% Fib levels comes at 1923.75, expected to provide support. Similarly, the daily 61.8% fib level is at 1928.08, expected to provide resistance.
Note the levels of interest below:
- Pivot support is noted at 1917.24, 1907.8, 1898.87
- Pivot resistance is noted at 1935.61, 1944.54, 1953.98
| Levels | Levels.1 |
|---|---|
| Previous Daily High | 1935.10 |
| Previous Daily Low | 1916.73 |
| Previous Weekly High | 1949.27 |
| Previous Weekly Low | 1911.45 |
| Previous Monthly High | 1833.38 |
| Previous Monthly Low | 1765.89 |
| Daily Fibonacci 38.2% | 1923.75 |
| Daily Fibonacci 61.8% | 1928.08 |
| Daily Pivot Point S1 | 1917.24 |
| Daily Pivot Point S2 | 1907.80 |
| Daily Pivot Point S3 | 1898.87 |
| Daily Pivot Point R1 | 1935.61 |
| Daily Pivot Point R2 | 1944.54 |
| Daily Pivot Point R3 | 1953.98 |
[/s2If]
Join Our Telegram Group
")


