#XAUUSD @ 1,925.26 Gold is subdued, though barely above its opening price, ahead of the Federal Reserve meeting. (Pivot Orderbook analysis)
…
This is a premium post.
[s2If !current_user_can(access_s2member_level4)]Please register for PREMIUM VERSION HERE to read full post below containing analysis. In case of any error or you think you are not able to read the full post below, please email us at support#nehcap.com [lwa][/s2If] [s2If current_user_can(access_s2member_level4)]
- Gold is subdued, though barely above its opening price, ahead of the Federal Reserve meeting.
- United States last week’s data justifies the Fed’s case to slow the size of interest rate increases.
- Gold Price Forecast: Choppy trading, still mostly sideways with traders sidelined ahead of the Fed’s decision.
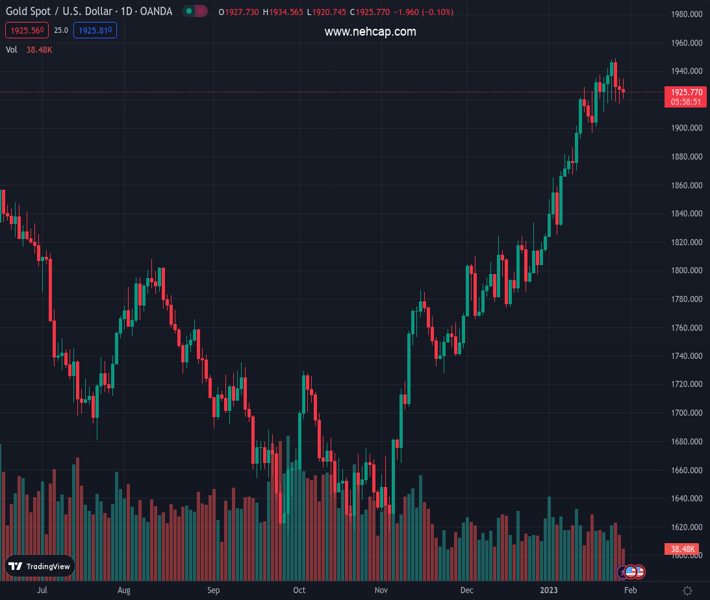
The pair currently trades last at 1925.26.
The previous day high was 1935.1 while the previous day low was 1916.73. The daily 38.2% Fib levels comes at 1923.75, expected to provide support. Similarly, the daily 61.8% fib level is at 1928.08, expected to provide resistance.
Gold price trades mostly sideways due to investors preparing for the US Federal Reserve Open Market Committee (FOMC) meeting, which will begin on Tuesday. Most analysts estimate the US Federal Reserve (Fed) would increase rates by 25 bps, though they will be looking for cues about future meetings. Therefore, the XAU/USD exchanges hands at $1,928.45 a troy ounce at the time of writing.
Wall Street opened mixed ahead of an important week for the economy of the United States (US). Last week’s data, led by the Advanced Gross Domestic Product (GDP) release for Q4, stood at 2.9%, above estimates of 2.6% QoQ, portraying a strong economy. Nevertheless, it decelerated compared to Q3’s 3.2%, further confirmed by data from the US Department of Commerce (DoC). That said, financial analysts have priced in a 25 bps rate increase to the US Federal Funds rate (FFR).
Another reason that justifies lower-size moves is inflation. The Fed’s preferred inflation gauge, the US Core Personal Consumption Expenditures (PCE), came at 4.4% YoY, aligned with estimates but lower than November’s 4.7%. Inflation has fallen for four straight months, supporting some Fed officials expressing the need to lower the pace of rate hikes but emphasizing that no cuts are foreseen for 2023.
Additionally, inflation expectations reported by a survey of the University of Michigan (UoM), portrayed American consumers estimated elevated prices would fall. Inflation in one year is expected at 3.9%, while for a 5-year horizon, it would fall from 3% to 2.9%. Consumer Sentiment improved as well, from 59.7 to 64.9 in January.
Given the backdrop, a Fed’s pause on its tightening cycle could bolster demand for Gold. Furthermore, if US Treasury bond yields commence edging lower, that would undermine the Greenback and boost XAU/USD, which could rally towards the $2,000 mark.
At the time of typing, US Treasury bond yields rise three basis points (bps), and edge up to 3.535%, while the Greenback is almost unchanged. The US Dollar Index (DXY), which tracks the buck’s value against a basket of peers, is up 0.01%, at 101.930.
XAU/USD’s price action remains subdued, influenced by fundamental reasons. After peaking at $1,949.16, Gold slumped towards $1,916.72 last Friday, and prices remain trapped within the $1,920-35 range. In addition, oscillators like the Relative Strength Index (RSI) and the Rate of Change (RoC) are slightly skewed to the downside, but the RSI’s still in bullish territory.
If the XAU/USD extends its gains above the top of the range, the next stop would be the YTD high at $1,949.16, followed by the $2,000 psychological level. On the other hand, the XAU/USD breaking support would send the yellow metal slumping towards $1,900, followed by the 20-day Exponential Moving Average (EMA) at $1,899.75, and then January’s 18 low of $1,896.74
Technical Levels: Supports and Resistances
XAUUSD currently trading at 1928.87 at the time of writing. Pair opened at 1926.68 and is trading with a change of 0.11 % .
| Overview | Overview.1 | |
|---|---|---|
| 0 | Today last price | 1928.87 |
| 1 | Today Daily Change | 2.19 |
| 2 | Today Daily Change % | 0.11 |
| 3 | Today daily open | 1926.68 |
The pair remains strongly bullish on the daily timeframe. It trades above its 20 SMA @ 1896.14, 50 SMA 1829.25, 100 SMA @ 1755.29 and 200 SMA @ 1775.48.
| Trends | Trends.1 | |
|---|---|---|
| 0 | Daily SMA20 | 1896.14 |
| 1 | Daily SMA50 | 1829.25 |
| 2 | Daily SMA100 | 1755.29 |
| 3 | Daily SMA200 | 1775.48 |
The previous day high was 1935.1 while the previous day low was 1916.73. The daily 38.2% Fib levels comes at 1923.75, expected to provide support. Similarly, the daily 61.8% fib level is at 1928.08, expected to provide resistance.
Note the levels of interest below:
- Pivot support is noted at 1917.24, 1907.8, 1898.87
- Pivot resistance is noted at 1935.61, 1944.54, 1953.98
| Levels | Levels.1 |
|---|---|
| Previous Daily High | 1935.10 |
| Previous Daily Low | 1916.73 |
| Previous Weekly High | 1949.27 |
| Previous Weekly Low | 1911.45 |
| Previous Monthly High | 1833.38 |
| Previous Monthly Low | 1765.89 |
| Daily Fibonacci 38.2% | 1923.75 |
| Daily Fibonacci 61.8% | 1928.08 |
| Daily Pivot Point S1 | 1917.24 |
| Daily Pivot Point S2 | 1907.80 |
| Daily Pivot Point S3 | 1898.87 |
| Daily Pivot Point R1 | 1935.61 |
| Daily Pivot Point R2 | 1944.54 |
| Daily Pivot Point R3 | 1953.98 |
[/s2If]
Join Our Telegram Group
")


