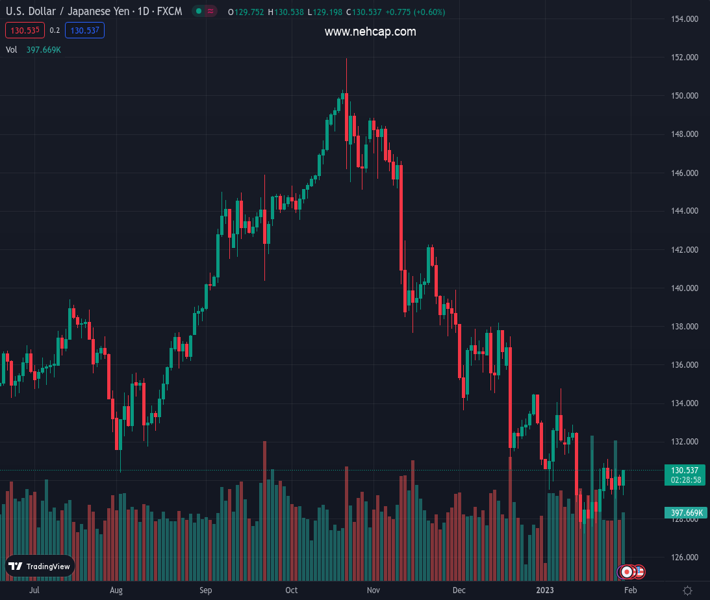
#USDJPY @ 130.524 recovers some ground as traders brace for a busy US economic calendar. (Pivot Orderbook analysis)
…
This is a premium post.
[s2If !current_user_can(access_s2member_level4)]Please register for PREMIUM VERSION HERE to read full post below containing analysis. In case of any error or you think you are not able to read the full post below, please email us at support#nehcap.com [lwa][/s2If] [s2If current_user_can(access_s2member_level4)]
- USD/JPY recovers some ground as traders brace for a busy US economic calendar.
- Buyers are eyeing a test of the 20-day EMA, as the RSI and RoC suggest the USD/JPY could print a leg-up in the near term.
- SUD/JPY Price Analysis: Remains downward biased, but it could aim higher.
The pair currently trades last at 130.524.
The previous day high was 130.28 while the previous day low was 129.5. The daily 38.2% Fib levels comes at 129.8, expected to provide support. Similarly, the daily 61.8% fib level is at 129.98, expected to provide support.
USD/JPY erases last Friday’s losses and reaches a new session high at 130.49, though slightly beneath the 20-day Exponential Moving Average (EMA), used as a barometer for short-term bias, which remains above the exchange rate. Therefore, the USD/JPY remains bearish despite trading at 130.49, above its opening price by 0.56%.
From a price action point of view, the USD/JPY remains bearish biased, even though it printed new daily highs. However, USD/JPY buyers need to clear the 20-day EMA at 130.57, to open the door for further gains. Traders should be aware the Rate of Change (RoC) depicts the buyer gaining momentum, while the Relative Strength Index (RSI) is about to turn bullish, suggesting that upward pressure is building.
Therefore, the USD/JPY first resistance would be the 131.00 figure. A breach of the latter will expose a one-month-old downslope trendline at around 131.330-40, followed by the January 18 daily high at 131.57, and then January’s 11 swing high
As an alternate scenario, if the USD/JPY tumbles below 130.00. the next support would be the January 30 daily low of 129.19. A breach of the latter will expose the psychological 128.00, followed by the YTD low at 127.21.
Technical Levels: Supports and Resistances
USDJPY currently trading at 130.47 at the time of writing. Pair opened at 129.88 and is trading with a change of 0.45 % .
| Overview | Overview.1 | |
|---|---|---|
| 0 | Today last price | 130.47 |
| 1 | Today Daily Change | 0.59 |
| 2 | Today Daily Change % | 0.45 |
| 3 | Today daily open | 129.88 |
The pair is trading above its 20 Daily moving average @ 130.38, below its 50 Daily moving average @ 133.83 , below its 100 Daily moving average @ 139.46 and below its 200 Daily moving average @ 136.76
| Trends | Trends.1 | |
|---|---|---|
| 0 | Daily SMA20 | 130.38 |
| 1 | Daily SMA50 | 133.83 |
| 2 | Daily SMA100 | 139.46 |
| 3 | Daily SMA200 | 136.76 |
The previous day high was 130.28 while the previous day low was 129.5. The daily 38.2% Fib levels comes at 129.8, expected to provide support. Similarly, the daily 61.8% fib level is at 129.98, expected to provide support.
Note the levels of interest below:
- Pivot support is noted at 129.49, 129.11, 128.71
- Pivot resistance is noted at 130.27, 130.67, 131.05
| Levels | Levels.1 |
|---|---|
| Previous Daily High | 130.28 |
| Previous Daily Low | 129.50 |
| Previous Weekly High | 131.12 |
| Previous Weekly Low | 129.02 |
| Previous Monthly High | 138.18 |
| Previous Monthly Low | 130.57 |
| Daily Fibonacci 38.2% | 129.80 |
| Daily Fibonacci 61.8% | 129.98 |
| Daily Pivot Point S1 | 129.49 |
| Daily Pivot Point S2 | 129.11 |
| Daily Pivot Point S3 | 128.71 |
| Daily Pivot Point R1 | 130.27 |
| Daily Pivot Point R2 | 130.67 |
| Daily Pivot Point R3 | 131.05 |
[/s2If]
Join Our Telegram Group
")


