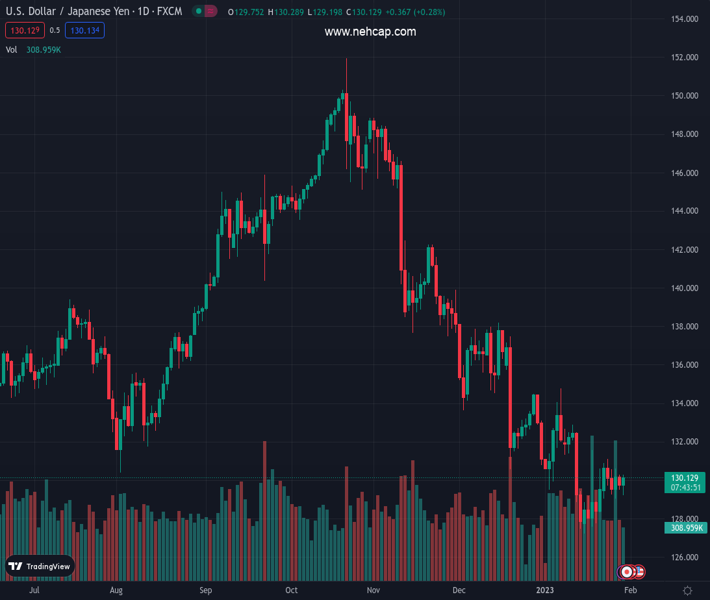
#USDJPY @ 130.134 gains some positive traction, though remains confined in a familiar trading range. (Pivot Orderbook analysis)
…
This is a premium post.
[s2If !current_user_can(access_s2member_level4)]Please register for PREMIUM VERSION HERE to read full post below containing analysis. In case of any error or you think you are not able to read the full post below, please email us at support#nehcap.com [lwa][/s2If] [s2If current_user_can(access_s2member_level4)]
- USD/JPY gains some positive traction, though remains confined in a familiar trading range.
- The mixed fundamental backdrop is seen holding back traders from placing aggressive bets.
- A convincing break below ascending trend-line support will set the stage for deeper losses.
The pair currently trades last at 130.134.
The previous day high was 130.28 while the previous day low was 129.5. The daily 38.2% Fib levels comes at 129.8, expected to provide support. Similarly, the daily 61.8% fib level is at 129.98, expected to provide support.
The USD/JPY pair attracts some dip-buying near the 129.20 region on Monday and climbs to a fresh daily top heading into the North American session. Spot prices, for now, seem to have stabilized above the 130.00 psychological mark, though remain well within a familiar trading range held over the past one-and-half week or so.
A goodish pickup in the US Treasury bond yields widens the US-Japan rate differential, which, in turn, is seen weighing on the Japanese Yen (JPY) and lending support to the USD/JPY pair. That said, a weaker risk tone, along with speculation that high inflation may invite a more hawkish stance from the Bank of Japan later this year, limit losses for the JPY. Apart from this, the underlying bearish sentiment surrounding the US Dollar keeps a lid on any meaningful upside for the major.
From a technical perspective, the recent recovery from the 127.20 area, or a multi-month low touched on January 16, has been along upward-sloping trend-line support. The USD/JPY pair, however, seem to struggle to capitalize on the move beyond the 100-period SMA on the 4-hour chart. This is followed by a stiff hurdle near the 130.60-130.65 heavy supply zone, which should now act as a key pivotal point. A sustained strength beyond should pave the way for some meaningful appreciating move.
Given that oscillators on hourly charts have again started gaining positive traction, the USD/JPY pair might then aim to reclaim the 131.00 round-figure mark. The momentum could get extended further towards the post-BoJ swing high, around the 131.55-131.60 area, en route to the 132.00 mark and the next hurdle near the 132.40-132.50 region.
On the flip side, the aforementioned ascending trend-line support, currently around the 129.15 area, might continue to protect the immediate downside. Some follow-through selling below the 129.00 mark will be seen as a fresh trigger for bearish traders and make the USD/JPY pair vulnerable. The subsequent slide could drag spot prices to the 128.00 round figure en route to the multi-month low, around the 127.20 region.
Technical Levels: Supports and Resistances
USDJPY currently trading at 130.03 at the time of writing. Pair opened at 129.88 and is trading with a change of 0.12 % .
| Overview | Overview.1 | |
|---|---|---|
| 0 | Today last price | 130.03 |
| 1 | Today Daily Change | 0.15 |
| 2 | Today Daily Change % | 0.12 |
| 3 | Today daily open | 129.88 |
The pair remains strongly bearish on the daily time frame. It trades below the 20 SMA @ 130.38, 50 SMA 133.83, 100 SMA @ 139.46 and 200 SMA @ 136.76.
| Trends | Trends.1 | |
|---|---|---|
| 0 | Daily SMA20 | 130.38 |
| 1 | Daily SMA50 | 133.83 |
| 2 | Daily SMA100 | 139.46 |
| 3 | Daily SMA200 | 136.76 |
The previous day high was 130.28 while the previous day low was 129.5. The daily 38.2% Fib levels comes at 129.8, expected to provide support. Similarly, the daily 61.8% fib level is at 129.98, expected to provide support.
Note the levels of interest below:
- Pivot support is noted at 129.49, 129.11, 128.71
- Pivot resistance is noted at 130.27, 130.67, 131.05
| Levels | Levels.1 |
|---|---|
| Previous Daily High | 130.28 |
| Previous Daily Low | 129.50 |
| Previous Weekly High | 131.12 |
| Previous Weekly Low | 129.02 |
| Previous Monthly High | 138.18 |
| Previous Monthly Low | 130.57 |
| Daily Fibonacci 38.2% | 129.80 |
| Daily Fibonacci 61.8% | 129.98 |
| Daily Pivot Point S1 | 129.49 |
| Daily Pivot Point S2 | 129.11 |
| Daily Pivot Point S3 | 128.71 |
| Daily Pivot Point R1 | 130.27 |
| Daily Pivot Point R2 | 130.67 |
| Daily Pivot Point R3 | 131.05 |
[/s2If]
Join Our Telegram Group
")


