#USDJPY @ 130.011 struggles to extend two-week uptrend, bounces off intraday low of late. (Pivot Orderbook analysis)
…
This is a premium post.
[s2If !current_user_can(access_s2member_level4)]Please register for PREMIUM VERSION HERE to read full post below containing analysis. In case of any error or you think you are not able to read the full post below, please email us at support#nehcap.com [lwa][/s2If] [s2If current_user_can(access_s2member_level4)]
- USD/JPY struggles to extend two-week uptrend, bounces off intraday low of late.
- BoJ’s sustained defense of YCC contrasts with talks surrounding Fed’s pivot to keep bears hopeful.
- Rebound in yields, US Dollar challenge Yen pair sellers amid light calendar.
- China’s return from holidays, US employment numbers also eyed for clear directions.
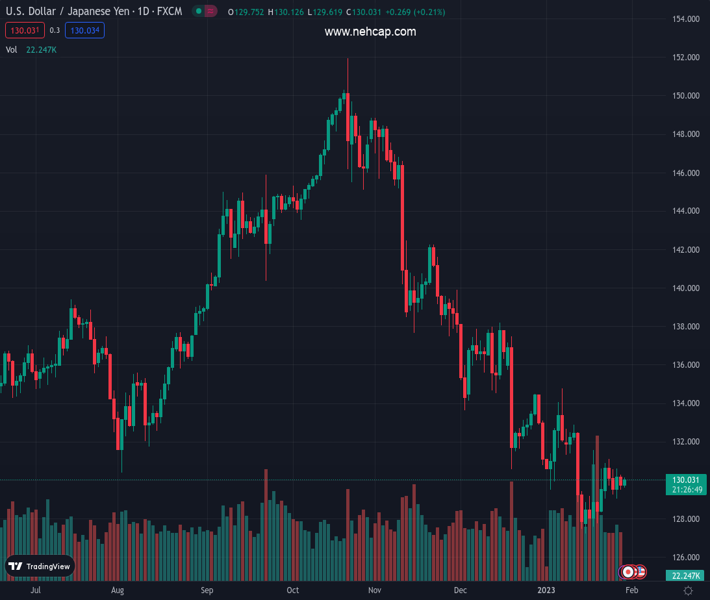
The pair currently trades last at 130.011.
The previous day high was 130.28 while the previous day low was 129.5. The daily 38.2% Fib levels comes at 129.8, expected to provide support. Similarly, the daily 61.8% fib level is at 129.98, expected to provide support.
USD/JPY remains on the back foot around 129.90, despite recently bouncing off the intraday low, as the traders in Tokyo begin the key week with mixed feelings. In doing so, the Yen pair challenges the previous two-week uptrend amid sluggish yields, cautious optimism in the market.
That said, China’s return from the Lunar New Year (LNY) holidays brought the good news of higher festive spending and the dragon nation’s readiness to boost consumption. On the same line could be the hopes of the Federal Reserve’s (Fed) dovish hike after the last week’s mixed data.
On Friday, the Federal Reserve’s preferred gauge of inflation, namely the Core Personal Consumption Expenditures (PCE) Price Index, matched 4.4% YoY market forecast versus 4.7% prior while the monthly figure rose to 0.3% versus 0.2% expected and previous readings. Ahead of that, the US Bureau of Economic Analysis’ (BEA) first estimate of the US fourth quarter (Q4) Gross Domestic Product marked an annualized growth rate of 2.9% versus 2.6% expected and 3.2% prior. On the same line, the Durable Goods Orders jumped 5.6% in December versus the 2.5% market forecast and -1.7% upwardly revised prior.
Alternatively, the Bank of Japan’s (BoJ) repeated attempts to defend the Yield Curve Control (YCC), amid recently firmer inflation data from Tokyo, exert downside pressure on the USD/JPY prices.
Against this backdrop, the US 10-year Treasury yields remain lackluster near 3.51% after snapping a two-week downtrend whereas the S&P 500 Futures print mild losses.
Looking forward, a light calendar may restrict immediate USD/JPY moves but China’s return from holidays could entertain momentum traders. It’s worth observing that the latest market favor for the US Dollar and the Treasury bond yields may help the Yen pair in extending the previous two-week uptrend.
Above all, this week’s Federal Reserve (Fed) decision and the US employment data for January will be crucial for the market players to watch for clear directions.
Although the 21-DMA and a two-week-old ascending support line restrict short-term USD/JPY moves between 130.30 and 129.30 in that order, bullish MACD signals and recently firmer RSI (14) suggests that the buyers are flexing muscles for entry.
Technical Levels: Supports and Resistances
USDJPY currently trading at 129.84 at the time of writing. Pair opened at 129.88 and is trading with a change of -0.03% % .
| Overview | Overview.1 | |
|---|---|---|
| 0 | Today last price | 129.84 |
| 1 | Today Daily Change | -0.04 |
| 2 | Today Daily Change % | -0.03% |
| 3 | Today daily open | 129.88 |
The pair remains strongly bearish on the daily time frame. It trades below the 20 SMA @ 130.38, 50 SMA 133.83, 100 SMA @ 139.46 and 200 SMA @ 136.76.
| Trends | Trends.1 | |
|---|---|---|
| 0 | Daily SMA20 | 130.38 |
| 1 | Daily SMA50 | 133.83 |
| 2 | Daily SMA100 | 139.46 |
| 3 | Daily SMA200 | 136.76 |
The previous day high was 130.28 while the previous day low was 129.5. The daily 38.2% Fib levels comes at 129.8, expected to provide support. Similarly, the daily 61.8% fib level is at 129.98, expected to provide support.
Note the levels of interest below:
- Pivot support is noted at 129.49, 129.11, 128.71
- Pivot resistance is noted at 130.27, 130.67, 131.05
| Levels | Levels.1 |
|---|---|
| Previous Daily High | 130.28 |
| Previous Daily Low | 129.50 |
| Previous Weekly High | 131.12 |
| Previous Weekly Low | 129.02 |
| Previous Monthly High | 138.18 |
| Previous Monthly Low | 130.57 |
| Daily Fibonacci 38.2% | 129.80 |
| Daily Fibonacci 61.8% | 129.98 |
| Daily Pivot Point S1 | 129.49 |
| Daily Pivot Point S2 | 129.11 |
| Daily Pivot Point S3 | 128.71 |
| Daily Pivot Point R1 | 130.27 |
| Daily Pivot Point R2 | 130.67 |
| Daily Pivot Point R3 | 131.05 |
[/s2If]
Join Our Telegram Group
")


