#USDCNH @ 6.75001 struggles around intraday low as China returns after one-week-long LNY holiday. (Pivot Orderbook analysis)
…
This is a premium post.
[s2If !current_user_can(access_s2member_level4)]Please register for PREMIUM VERSION HERE to read full post below containing analysis. In case of any error or you think you are not able to read the full post below, please email us at support#nehcap.com [lwa][/s2If] [s2If current_user_can(access_s2member_level4)]
- USD/CNH struggles around intraday low as China returns after one-week-long LNY holiday.
- Upbeat festive spending, chatters over more efforts to boost consumption, imports keep CNH buyers hopeful.
- Pre-Fed anxiety, PBOC hints challenge USD/CNH bears amid full markets.
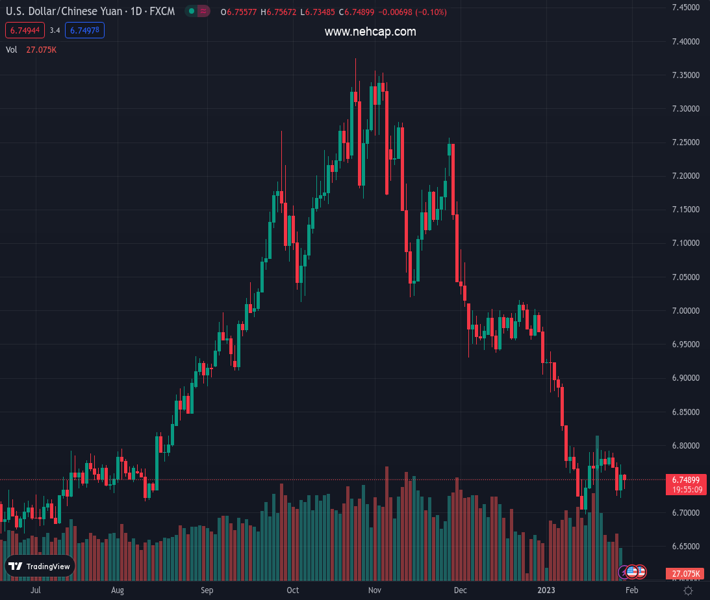
The pair currently trades last at 6.75001.
The previous day high was 6.7718 while the previous day low was 6.7218. The daily 38.2% Fib levels comes at 6.7527, expected to provide resistance. Similarly, the daily 61.8% fib level is at 6.7409, expected to provide support.
USD/CNH remains pressured around the intraday low near 6.7400 while fading fades the previous day’s corrective bounce off a two-week low during Monday’s Asian session. In doing so, the offshore Chinese Yuan (CNH) pair justifies the hawkish concerns surrounding the dragon nation ahead of the key data/events.
Among them, talks of increased spending in China during the festive season and readiness for further measures to boost growth and imports seem to have gained major attention. China’s cabinet said on Saturday it would promote a consumption recovery as the major driver of the economy and boost imports, state broadcaster CCTV reported per Reuters. The news highlights the cooling of global demand and recession concerns behind the readiness of China policymakers to act. Further, the Chinese tax authority mentioned that the week-long Lunar New Year holiday that ended on Friday propelled consumption by 12.2% from the same period last year.
Further, the People’s Bank of China’s (PBOC) readiness to introduce more tools to boost lending and growth probe the pair sellers.
Additionally, the dragon nation’s return from a one-week-long Lunar New Year (LNY) also boosts the market’s optimism in China. It should be noted that Shanghai Composite Index is up 1.3% while CSI 300 prints the bull markets’ signal after posting the 20% recovery from the lows printed in October 2022.
On the other hand, the hopes of the Federal Reserve’s (Fed) dovish hike after the last week’s mixed data seem to weigh on the USD/CNH prices.
That said, the Federal Reserve’s preferred gauge of inflation, namely the Core Personal Consumption Expenditures (PCE) Price Index, matched 4.4% YoY market forecast versus 4.7% prior while the monthly figure rose to 0.3% versus 0.2% expected and previous readings. Ahead of that, the US Bureau of Economic Analysis’ (BEA) first estimate of the US fourth quarter (Q4) Gross Domestic Product marked an annualized growth rate of 2.9% versus 2.6% expected and 3.2% prior. On the same line, the Durable Goods Orders jumped 5.6% in December versus the 2.5% market forecast and -1.7% upwardly revised prior.
Against this backdrop, the US 10-year Treasury yields remain lackluster near 3.51% after snapping a two-week downtrend whereas the S&P 500 Futures print mild losses.
Moving on, USD/CNH traders will pay close attention to January’s official PMIs, up for publishing on Tuesday, for immediate directions ahead of Wednesday’s Fed meeting and Friday’s US jobs report. Overall, the Fed’s inability to convince hawks could weigh on the pair.
Failure to cross a two-month-old descending resistance line, around 6.7580 by the press time, directs USD/CNH towards a two-week-old support line near 6.7250.
Technical Levels: Supports and Resistances
USDCNH currently trading at 6.7442 at the time of writing. Pair opened at 6.7574 and is trading with a change of -0.20% % .
| Overview | Overview.1 | |
|---|---|---|
| 0 | Today last price | 6.7442 |
| 1 | Today Daily Change | -0.0132 |
| 2 | Today Daily Change % | -0.20% |
| 3 | Today daily open | 6.7574 |
The pair remains strongly bearish on the daily time frame. It trades below the 20 SMA @ 6.7954, 50 SMA 6.9359, 100 SMA @ 7.0459 and 200 SMA @ 6.898.
| Trends | Trends.1 | |
|---|---|---|
| 0 | Daily SMA20 | 6.7954 |
| 1 | Daily SMA50 | 6.9359 |
| 2 | Daily SMA100 | 7.0459 |
| 3 | Daily SMA200 | 6.8980 |
The previous day high was 6.7718 while the previous day low was 6.7218. The daily 38.2% Fib levels comes at 6.7527, expected to provide resistance. Similarly, the daily 61.8% fib level is at 6.7409, expected to provide support.
Note the levels of interest below:
- Pivot support is noted at 6.729, 6.7004, 6.679
- Pivot resistance is noted at 6.7788, 6.8002, 6.8288
| Levels | Levels.1 |
|---|---|
| Previous Daily High | 6.7718 |
| Previous Daily Low | 6.7218 |
| Previous Weekly High | 6.7916 |
| Previous Weekly Low | 6.7218 |
| Previous Monthly High | 7.0914 |
| Previous Monthly Low | 6.9050 |
| Daily Fibonacci 38.2% | 6.7527 |
| Daily Fibonacci 61.8% | 6.7409 |
| Daily Pivot Point S1 | 6.7290 |
| Daily Pivot Point S2 | 6.7004 |
| Daily Pivot Point S3 | 6.6790 |
| Daily Pivot Point R1 | 6.7788 |
| Daily Pivot Point R2 | 6.8002 |
| Daily Pivot Point R3 | 6.8288 |
[/s2If]
Join Our Telegram Group
")


