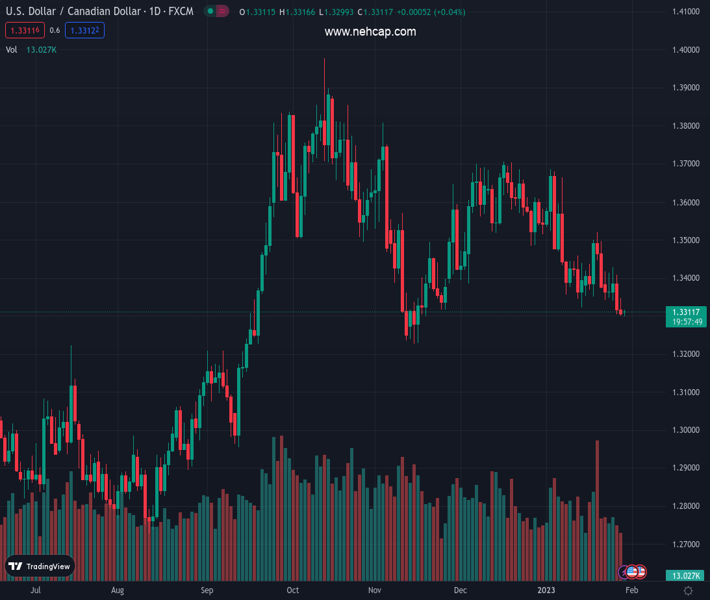
#USDCAD @ 1.33080 picks up bids to pare intraday losses after six-week downtrend., @nehcap view: Bearish (Pivot Orderbook analysis)
…
This is a premium post.
[s2If !current_user_can(access_s2member_level4)]Please register for PREMIUM VERSION HERE to read full post below containing analysis. In case of any error or you think you are not able to read the full post below, please email us at support#nehcap.com [lwa][/s2If] [s2If current_user_can(access_s2member_level4)]
- USD/CAD picks up bids to pare intraday losses after six-week downtrend.
- Bearish triangle, downbeat RSI (14) conditions challenge buyers.
- Late 2022 low could lure bears past 1.3290 immediate support.
- 200-HMA, weekly resistance line adds to the upside filters.
The pair currently trades last at 1.33080.
The previous day high was 1.3347 while the previous day low was 1.33. The daily 38.2% Fib levels comes at 1.3318, expected to provide resistance. Similarly, the daily 61.8% fib level is at 1.3329, expected to provide resistance.
USD/CAD bounces off intraday low to 1.3310 as bears take a breather following the six-week south-run during Monday’s Asian session.
Even so, the Loonie pair remains inside a bearish triangle formation established since Wednesday. Adding strength to the bearish bias is the downbeat RSI (14) line.
As a result, the quote’s corrective bounce is less likely to overcome the immediate hurdle, namely the resistance line of the stated triangle near 1.3325.
Even if the USD/CAD buyers manage to cross the 1.3325 hurdle, the previous support line from January 13 and the 200-Hour Moving Average (HMA), respectively near 1.3360 and 1.3395, could challenge the upside momentum.
It’s worth observing that a one-week-old downward-sloping resistance line near 1.3430 acts as the last defense of the USD/CAD bears, a break of which could propel the quote towards the January 19 swing high near 1.3520.
Alternatively, a downside break of the stated triangle, close to 1.3290 by the press time, could direct USD/CAD sellers towards the November 2022 low surrounding 1.3225 ahead of challenging the 1.3200 round figure.
Overall, the USD/CAD bears are likely to keep the reins unless the price stays successfully beyond 1.3520.
Trend: Bearish
Technical Levels: Supports and Resistances
USDCAD currently trading at 1.3306 at the time of writing. Pair opened at 1.3312 and is trading with a change of -0.05% % .
| Overview | Overview.1 | |
|---|---|---|
| 0 | Today last price | 1.3306 |
| 1 | Today Daily Change | -0.0006 |
| 2 | Today Daily Change % | -0.05% |
| 3 | Today daily open | 1.3312 |
The pair is trading below its 20 Daily moving average @ 1.3433, below its 50 Daily moving average @ 1.3503 , below its 100 Daily moving average @ 1.3525 and above its 200 Daily moving average @ 1.3208
| Trends | Trends.1 | |
|---|---|---|
| 0 | Daily SMA20 | 1.3433 |
| 1 | Daily SMA50 | 1.3503 |
| 2 | Daily SMA100 | 1.3525 |
| 3 | Daily SMA200 | 1.3208 |
The previous day high was 1.3347 while the previous day low was 1.33. The daily 38.2% Fib levels comes at 1.3318, expected to provide resistance. Similarly, the daily 61.8% fib level is at 1.3329, expected to provide resistance.
Note the levels of interest below:
- Pivot support is noted at 1.3293, 1.3273, 1.3246
- Pivot resistance is noted at 1.3339, 1.3366, 1.3385
| Levels | Levels.1 |
|---|---|
| Previous Daily High | 1.3347 |
| Previous Daily Low | 1.3300 |
| Previous Weekly High | 1.3428 |
| Previous Weekly Low | 1.3300 |
| Previous Monthly High | 1.3705 |
| Previous Monthly Low | 1.3385 |
| Daily Fibonacci 38.2% | 1.3318 |
| Daily Fibonacci 61.8% | 1.3329 |
| Daily Pivot Point S1 | 1.3293 |
| Daily Pivot Point S2 | 1.3273 |
| Daily Pivot Point S3 | 1.3246 |
| Daily Pivot Point R1 | 1.3339 |
| Daily Pivot Point R2 | 1.3366 |
| Daily Pivot Point R3 | 1.3385 |
[/s2If]
Join Our Telegram Group
")


