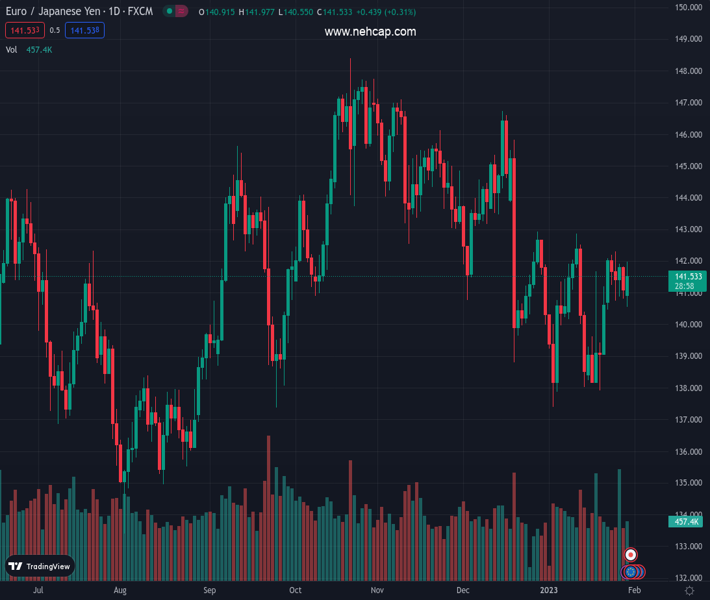
#EURJPY @ 141.537 stages a comeback and hits a three-day new high at 141.97, shy of the 142.00 mark. (Pivot Orderbook analysis)
…
This is a premium post.
[s2If !current_user_can(access_s2member_level4)]Please register for PREMIUM VERSION HERE to read full post below containing analysis. In case of any error or you think you are not able to read the full post below, please email us at support#nehcap.com [lwa][/s2If] [s2If current_user_can(access_s2member_level4)]
- EUR/JPY stages a comeback and hits a three-day new high at 141.97, shy of the 142.00 mark.
- EUR/JPY Price Analysis: Sideways awaiting a catalyst to gather direction.
The pair currently trades last at 141.537.
The previous day high was 141.92 while the previous day low was 140.82. The daily 38.2% Fib levels comes at 141.24, expected to provide support. Similarly, the daily 61.8% fib level is at 141.5, expected to provide support.
The Euro (EUR) is recovering some ground against the Japanese Yen (JPY), as the Wall Street close looms, after hitting two-week lows of 140.55, though it staged a comeback and traveled back to the day’s high at 141.97. At the time of writing, the EUR/JPY exchanges hands at 141.50, above its opening price.
After rallying from the January 19 daily low of 137.91 towards the January 25 daily high of 142.29, the USD/JPY remains trapped in a 250 pip range within the 140.75-142.39 range for the last five days. Furthermore, the 20-day Exponential Moving Average (EMA) at 140.94 and the 50-day EMA at 141.70 acted as the support/resistance of the range. Therefore, the EUR/JPY is trendless amid the lack of a catalyst.
Oscillator-wise, the Relative Strength Index (RSI) at bullish territory backed today’s price action, contrary to the Rate of Change (RoC), which indicates sellers are beginning to gather momentum.
Therefore, the EUR/JPY first resistance would be the 50-day EMA at 141.70 and might rally once broken. The next resistance would be the 142.00 psychological level, ahead of the Wednesday 25 high at 142.29, followed by the 143.00 figure.
In an alternate scenario, if the USD/JPY pair breaks downwards, it would expose key support levels. First, the 20-day EMA at 140.94, followed by the 200-day EMA at 140.24, and then the psychological 140.00 mark.
Technical Levels: Supports and Resistances
EURJPY currently trading at 141.49 at the time of writing. Pair opened at 141.12 and is trading with a change of 0.26 % .
| Overview | Overview.1 | |
|---|---|---|
| 0 | Today last price | 141.49 |
| 1 | Today Daily Change | 0.37 |
| 2 | Today Daily Change % | 0.26 |
| 3 | Today daily open | 141.12 |
The pair is trading above its 20 Daily moving average @ 140.42, below its 50 Daily moving average @ 142.13 , below its 100 Daily moving average @ 143.1 and above its 200 Daily moving average @ 140.86
| Trends | Trends.1 | |
|---|---|---|
| 0 | Daily SMA20 | 140.42 |
| 1 | Daily SMA50 | 142.13 |
| 2 | Daily SMA100 | 143.10 |
| 3 | Daily SMA200 | 140.86 |
The previous day high was 141.92 while the previous day low was 140.82. The daily 38.2% Fib levels comes at 141.24, expected to provide support. Similarly, the daily 61.8% fib level is at 141.5, expected to provide support.
Note the levels of interest below:
- Pivot support is noted at 140.65, 140.19, 139.56
- Pivot resistance is noted at 141.75, 142.38, 142.85
| Levels | Levels.1 |
|---|---|
| Previous Daily High | 141.92 |
| Previous Daily Low | 140.82 |
| Previous Weekly High | 142.30 |
| Previous Weekly Low | 140.47 |
| Previous Monthly High | 146.73 |
| Previous Monthly Low | 138.80 |
| Daily Fibonacci 38.2% | 141.24 |
| Daily Fibonacci 61.8% | 141.50 |
| Daily Pivot Point S1 | 140.65 |
| Daily Pivot Point S2 | 140.19 |
| Daily Pivot Point S3 | 139.56 |
| Daily Pivot Point R1 | 141.75 |
| Daily Pivot Point R2 | 142.38 |
| Daily Pivot Point R3 | 142.85 |
[/s2If]
Join Our Telegram Group
")


