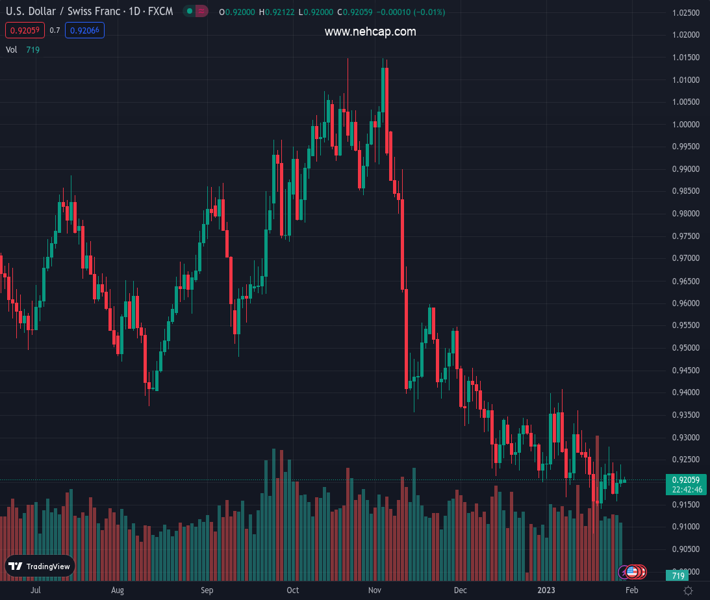
#USDCHF @ 0.92060 grinds higher inside monthly triangle, struggling to extend two-day uptrend., @nehcap view: Further upside expected (Pivot Orderbook analysis)
…
This is a premium post.
[s2If !current_user_can(access_s2member_level4)]Please register for PREMIUM VERSION HERE to read full post below containing analysis. In case of any error or you think you are not able to read the full post below, please email us at support#nehcap.com [lwa][/s2If] [s2If current_user_can(access_s2member_level4)]
- USD/CHF grinds higher inside monthly triangle, struggling to extend two-day uptrend.
- Sustained break of 10-DMA, bullish MACD signals keep buyers hopeful.
- USD/CHF buyers lurk around six-week-old descending support line.
The pair currently trades last at 0.92060.
The previous day high was 0.924 while the previous day low was 0.919. The daily 38.2% Fib levels comes at 0.9221, expected to provide resistance. Similarly, the daily 61.8% fib level is at 0.9209, expected to provide resistance.
USD/CHF bulls take a breather around 0.9210 during Monday’s sluggish Asian session, following a two-day uptrend, as traders await this week’s bumper data/events. Also challenging the Swiss Franc (CHF) pair is the return of Chinese traders after a one-week-long Lunar New Year (LNY) holiday.
It’s worth noting that the quote marked the first daily closing beyond the 10-DMA since January 11 the previous day. That said, the upside break of the short-term key moving average joins the bullish MACD signals to suggest the USD/CHF pair’s further upside.
However, a symmetrical triangle formation connecting levels marked since January 06 restricts short-term USD/CHF moves between 0.9235 and 0.9170.
It should be observed that a downward-sloping support line from December 14, 2022, close to 0.9125 by the press time, acts as an extra filter towards the north.
In a case where the USD/CHF bears dominate past 0.9125, the 0.9100 round figure and the monthly low of 0.9085 could act as the last defense of the buyer.
On the flip side, a successful break of the 0.9235 hurdle could propel the USD/CHF buyers toward the monthly peak surrounding 0.9410. It’s worth observing that the August 2022 low near 0.9370 acts as an extra filter towards the north.
Trend: Further upside expected
Technical Levels: Supports and Resistances
USDCHF currently trading at 0.9209 at the time of writing. Pair opened at 0.9212 and is trading with a change of -0.03% % .
| Overview | Overview.1 | |
|---|---|---|
| 0 | Today last price | 0.9209 |
| 1 | Today Daily Change | -0.0003 |
| 2 | Today Daily Change % | -0.03% |
| 3 | Today daily open | 0.9212 |
The pair remains strongly bearish on the daily time frame. It trades below the 20 SMA @ 0.9245, 50 SMA 0.9318, 100 SMA @ 0.9569 and 200 SMA @ 0.9632.
| Trends | Trends.1 | |
|---|---|---|
| 0 | Daily SMA20 | 0.9245 |
| 1 | Daily SMA50 | 0.9318 |
| 2 | Daily SMA100 | 0.9569 |
| 3 | Daily SMA200 | 0.9632 |
The previous day high was 0.924 while the previous day low was 0.919. The daily 38.2% Fib levels comes at 0.9221, expected to provide resistance. Similarly, the daily 61.8% fib level is at 0.9209, expected to provide resistance.
Note the levels of interest below:
- Pivot support is noted at 0.9188, 0.9164, 0.9139
- Pivot resistance is noted at 0.9238, 0.9264, 0.9287
| Levels | Levels.1 |
|---|---|
| Previous Daily High | 0.9240 |
| Previous Daily Low | 0.9190 |
| Previous Weekly High | 0.9280 |
| Previous Weekly Low | 0.9158 |
| Previous Monthly High | 0.9471 |
| Previous Monthly Low | 0.9201 |
| Daily Fibonacci 38.2% | 0.9221 |
| Daily Fibonacci 61.8% | 0.9209 |
| Daily Pivot Point S1 | 0.9188 |
| Daily Pivot Point S2 | 0.9164 |
| Daily Pivot Point S3 | 0.9139 |
| Daily Pivot Point R1 | 0.9238 |
| Daily Pivot Point R2 | 0.9264 |
| Daily Pivot Point R3 | 0.9287 |
[/s2If]
Join Our Telegram Group
")


