#XAUUSD @ 1,930.71 US Dollar climbs as the Federal Reserve preferred gauge for inflation, with core PCE creeping lower. (Pivot Orderbook analysis)
…
This is a premium post.
[s2If !current_user_can(access_s2member_level4)]Please register for PREMIUM VERSION HERE to read full post below containing analysis. In case of any error or you think you are not able to read the full post below, please email us at support#nehcap.com [lwa][/s2If] [s2If current_user_can(access_s2member_level4)]
- US Dollar climbs as the Federal Reserve preferred gauge for inflation, with core PCE creeping lower.
- According to the University of Michigan (UoM) poll, US consumers’ inflation expectations edged lower.
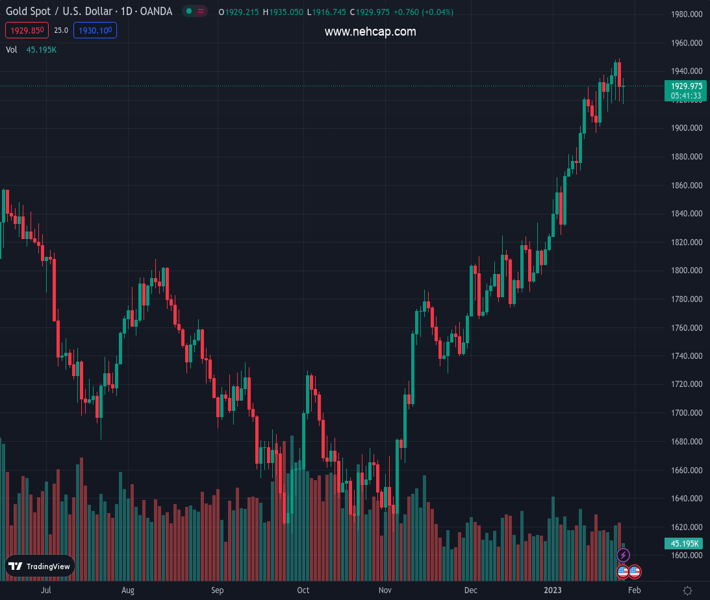
- Gold Price Analysis: The rally from $1,616.71 to $1,949.16 could end, as a doji emerged in the weekly chart.
The pair currently trades last at 1930.71.
The previous day high was 1949.27 while the previous day low was 1918.67. The daily 38.2% Fib levels comes at 1930.36, expected to provide support. Similarly, the daily 61.8% fib level is at 1937.58, expected to provide resistance.
Gold price falls for the second consecutive day, but it remains above January’s 26 low of $1,918.74 and stays sideways, following the release of inflation data in the United States (US). The US Dollar (USD) shortened its drop during the week, while US Treasury bond yields are rising, two additional reasons behind Gold’s loss of its brightness. At the time of writing, the XAU/USD is trading at $1,924.39 after hitting a daily high of $1,935.06.
Wall Street turned green after the US Department of Commerce (DoC) revealed that the US Federal Reserve (Fed) preferred gauge for inflation, the Core Personal Consumption Expenditure (PCE) for December, rose 4.4% YoY, aligned with estimates, but lower than November’s 4.7%. The same report showed that headline inflation climbed 5% on a yearly basis, above the Fed’s 2% target. That said, data showed that inflation has begun to trend downwards finally, and traders brace for the Federal Reserve’s meeting next week. Speculations had been mounting that the Fed might raise rates by 25 bps, which would mark the end of 50-plus bps rate increases to the Federal Funds rate (FFR).
Later, the University of Michigan (UoM) Consumer Sentiment on its Final reading exceeded estimates of 64.6 and rose by 64.9. The survey conducted by the University of Michigan updated inflation expectations, with a one-year horizon estimated at 3.9%, while for a 5-year rose to 2.9% compared to the preliminary 3.0%,
Meanwhile, US Treasury bond yields continue to be headwinds for Gold. The US 10-year Treasury bond yield continues to edge higher, almost four bps, and yields 3.540%, underpinning the greenback. The US Dollar Index (DXY), which tracks the buck’s performance against a basket of six peers, advanced 0.22%, and reclaimed the 102.000 mark at 102.051.
Even though the XAU/USD remains slightly positive in the week, a doji emerging after a two-and-a-half-month rally from $1,616.71 to $1,949.16 suggests it could end. As XAU/USD drops below Thursday’s close, it has opened the door for further downside, but a daily close below the weekly low reached on Monday at $1,911.49 is needed to pave the way for a dip to $1,900. If that scenario plays out, the next support area would be the confluence of the January 18 low and the 20-day Exponential Moving Average (EMA) at around $1,896/97. Conversely, XAU/USD’s reclaiming $1,930 would keep Gold sideways.
Technical Levels: Supports and Resistances
XAUUSD currently trading at 1925.85 at the time of writing. Pair opened at 1929.72 and is trading with a change of -0.2 % .
| Overview | Overview.1 | |
|---|---|---|
| 0 | Today last price | 1925.85 |
| 1 | Today Daily Change | -3.87 |
| 2 | Today Daily Change % | -0.20 |
| 3 | Today daily open | 1929.72 |
The pair remains strongly bullish on the daily timeframe. It trades above its 20 SMA @ 1890.99, 50 SMA 1825.69, 100 SMA @ 1753.19 and 200 SMA @ 1775.5.
| Trends | Trends.1 | |
|---|---|---|
| 0 | Daily SMA20 | 1890.99 |
| 1 | Daily SMA50 | 1825.69 |
| 2 | Daily SMA100 | 1753.19 |
| 3 | Daily SMA200 | 1775.50 |
The previous day high was 1949.27 while the previous day low was 1918.67. The daily 38.2% Fib levels comes at 1930.36, expected to provide support. Similarly, the daily 61.8% fib level is at 1937.58, expected to provide resistance.
Note the levels of interest below:
- Pivot support is noted at 1915.84, 1901.95, 1885.24
- Pivot resistance is noted at 1946.44, 1963.15, 1977.04
| Levels | Levels.1 |
|---|---|
| Previous Daily High | 1949.27 |
| Previous Daily Low | 1918.67 |
| Previous Weekly High | 1937.57 |
| Previous Weekly Low | 1896.63 |
| Previous Monthly High | 1833.38 |
| Previous Monthly Low | 1765.89 |
| Daily Fibonacci 38.2% | 1930.36 |
| Daily Fibonacci 61.8% | 1937.58 |
| Daily Pivot Point S1 | 1915.84 |
| Daily Pivot Point S2 | 1901.95 |
| Daily Pivot Point S3 | 1885.24 |
| Daily Pivot Point R1 | 1946.44 |
| Daily Pivot Point R2 | 1963.15 |
| Daily Pivot Point R3 | 1977.04 |
[/s2If]
Join Our Telegram Group
")


