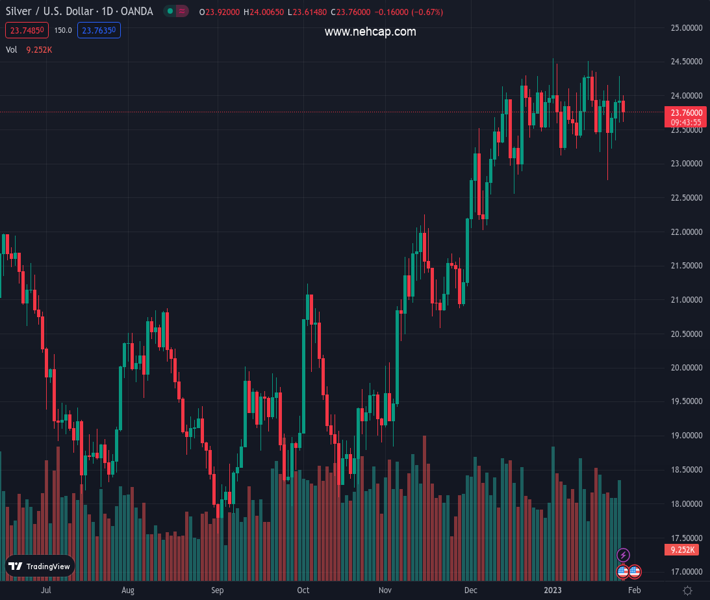
#XAGUSD @ 23.753 Silver comes under some renewed selling pressure on the last day of the week. (Pivot Orderbook analysis)
…
This is a premium post.
[s2If !current_user_can(access_s2member_level4)]Please register for PREMIUM VERSION HERE to read full post below containing analysis. In case of any error or you think you are not able to read the full post below, please email us at support#nehcap.com [lwa][/s2If] [s2If current_user_can(access_s2member_level4)]
- Silver comes under some renewed selling pressure on the last day of the week.
- The technical setup supports prospects for a further intraday depreciating move.
- A sustained move beyond the $24.50-$24.55 area will negate the negative bias.
The pair currently trades last at 23.753.
The previous day high was 24.3 while the previous day low was 23.6. The daily 38.2% Fib levels comes at 24.03, expected to provide resistance. Similarly, the daily 61.8% fib level is at 23.87, expected to provide resistance.
Silver extends the previous day’s retracement slide from the $24.30 area, or over a one-week high, and remains under some selling pressure on Friday. The white metal maintains its offered tone through the mid-European session and is currently placed near the daily low, around the $23.70 region.
From a technical perspective, the XAG/USD, so far, has managed to defend the lower end of a four-day-old ascending trend channel. The said support coincides with the 100-hour SMA and should now act as a pivotal point for short-term traders. Given that oscillators on hourly charts have been gaining some negative traction, a convincing break below will set the stage for further losses.
The XAG/USD might then accelerate the fall towards intermediate support near the $23.50-$23.45 area before eventually dropping to test sub-$23.00 levels. This is followed by the weekly low, around the $22.75 region touched on Monday. Some follow-through selling has the potential to drag the commodity further towards testing the next relevant support near the $22.00 round figure.
On the flip side, the daily swing high, around the $24.00 mark, might now act as an immediate hurdle. Any further move up might confront resistance near the $24.25-$24.30 region ahead of the $24.50-$24.55 supply zone, or a multi-month high touched on January 16. A sustained strength beyond should allow the XAU/USD to reclaim the $25.00 psychological mark for the first time since April 2022.
Technical Levels: Supports and Resistances
XAGUSD currently trading at 23.74 at the time of writing. Pair opened at 23.92 and is trading with a change of -0.75 % .
| Overview | Overview.1 | |
|---|---|---|
| 0 | Today last price | 23.74 |
| 1 | Today Daily Change | -0.18 |
| 2 | Today Daily Change % | -0.75 |
| 3 | Today daily open | 23.92 |
The pair is trading below its 20 Daily moving average @ 23.79, above its 50 Daily moving average @ 23.16 , above its 100 Daily moving average @ 21.45 and above its 200 Daily moving average @ 21.01
| Trends | Trends.1 | |
|---|---|---|
| 0 | Daily SMA20 | 23.79 |
| 1 | Daily SMA50 | 23.16 |
| 2 | Daily SMA100 | 21.45 |
| 3 | Daily SMA200 | 21.01 |
The previous day high was 24.3 while the previous day low was 23.6. The daily 38.2% Fib levels comes at 24.03, expected to provide resistance. Similarly, the daily 61.8% fib level is at 23.87, expected to provide resistance.
Note the levels of interest below:
- Pivot support is noted at 23.58, 23.24, 22.89
- Pivot resistance is noted at 24.27, 24.63, 24.97
| Levels | Levels.1 |
|---|---|
| Previous Daily High | 24.30 |
| Previous Daily Low | 23.60 |
| Previous Weekly High | 24.51 |
| Previous Weekly Low | 23.17 |
| Previous Monthly High | 24.30 |
| Previous Monthly Low | 22.03 |
| Daily Fibonacci 38.2% | 24.03 |
| Daily Fibonacci 61.8% | 23.87 |
| Daily Pivot Point S1 | 23.58 |
| Daily Pivot Point S2 | 23.24 |
| Daily Pivot Point S3 | 22.89 |
| Daily Pivot Point R1 | 24.27 |
| Daily Pivot Point R2 | 24.63 |
| Daily Pivot Point R3 | 24.97 |
[/s2If]
Join Our Telegram Group
")


