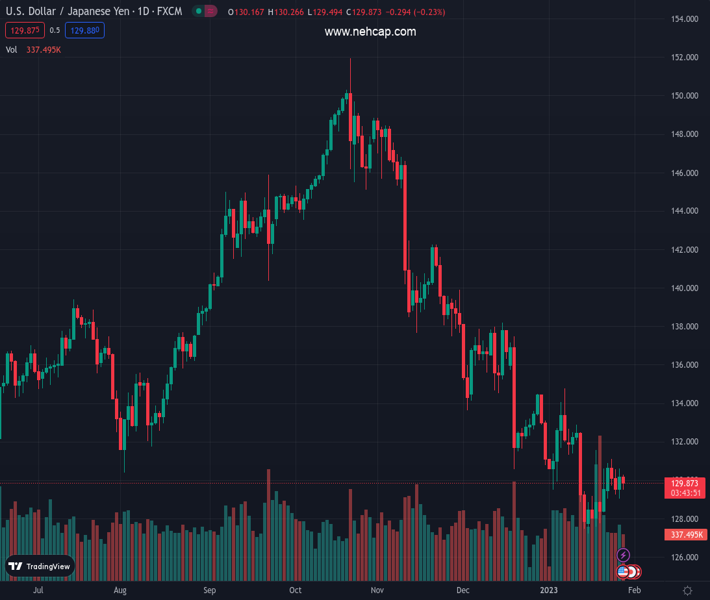
#USDJPY @ 129.884 remains downtrend but is about to form a bullish harami candle pattern, suggesting an upward correction on the cards. (Pivot Orderbook analysis)
…
This is a premium post.
[s2If !current_user_can(access_s2member_level4)]Please register for PREMIUM VERSION HERE to read full post below containing analysis. In case of any error or you think you are not able to read the full post below, please email us at support#nehcap.com [lwa][/s2If] [s2If current_user_can(access_s2member_level4)]
- USD/JPY remains downtrend but is about to form a bullish harami candle pattern, suggesting an upward correction on the cards.
- USD/JPY Price Analysis: Once it clears 129.50, it could rally towards 131.57 before turning neutral.
The pair currently trades last at 129.884.
The previous day high was 130.62 while the previous day low was 129.02. The daily 38.2% Fib levels comes at 130.01, expected to provide resistance. Similarly, the daily 61.8% fib level is at 129.63, expected to provide support.
USD/JPY slumps in a choppy New York trading session and edges beneath 130.00 after a round of US economic data, suggesting the US Federal Reserve (Fed) could begin to hike rates in 25 bps sizes. Therefore, the Japanese Yen (JPY) strengthened, so the USD/JPY is down 0.24%. At the time of writing, the USD/JPY is trading at 129.92.
The USD/JPY remains downward biased as the pair has remained below the 20-day Exponential Moving Average (EMA) at 130.60. Friday’s price action remains contained within the boundaries of Thursday’s high and low, opening the door for a bullish harami candlestick formation, also known as an inside day, in the regular bar chart jargon. Therefore, the USD/JPY could print a leg-up before resuming its downtrend.
Hence, the USD/JPY next resistance would be 130.00, followed by the confluence of the 20-day EMA and a downslope trendline around 130.60, which, once cleared, might send the USD/JPY climbing towards the January 24 swing high at 131.11. Break above will expose the January 18 high of 131.57.
As an alternate scenario, the USD/JPY could fall towards 129.49, January’s 27 low. Once broken, the next support would be the weekly low of 129.02, followed by the YTD low at 127.21.
Technical Levels: Supports and Resistances
USDJPY currently trading at 129.92 at the time of writing. Pair opened at 130.25 and is trading with a change of -0.25 % .
| Overview | Overview.1 | |
|---|---|---|
| 0 | Today last price | 129.92 |
| 1 | Today Daily Change | -0.33 |
| 2 | Today Daily Change % | -0.25 |
| 3 | Today daily open | 130.25 |
The pair remains strongly bearish on the daily time frame. It trades below the 20 SMA @ 130.45, 50 SMA 134.04, 100 SMA @ 139.59 and 200 SMA @ 136.76.
| Trends | Trends.1 | |
|---|---|---|
| 0 | Daily SMA20 | 130.45 |
| 1 | Daily SMA50 | 134.04 |
| 2 | Daily SMA100 | 139.59 |
| 3 | Daily SMA200 | 136.76 |
The previous day high was 130.62 while the previous day low was 129.02. The daily 38.2% Fib levels comes at 130.01, expected to provide resistance. Similarly, the daily 61.8% fib level is at 129.63, expected to provide support.
Note the levels of interest below:
- Pivot support is noted at 129.31, 128.37, 127.71
- Pivot resistance is noted at 130.9, 131.56, 132.5
| Levels | Levels.1 |
|---|---|
| Previous Daily High | 130.62 |
| Previous Daily Low | 129.02 |
| Previous Weekly High | 131.58 |
| Previous Weekly Low | 127.22 |
| Previous Monthly High | 138.18 |
| Previous Monthly Low | 130.57 |
| Daily Fibonacci 38.2% | 130.01 |
| Daily Fibonacci 61.8% | 129.63 |
| Daily Pivot Point S1 | 129.31 |
| Daily Pivot Point S2 | 128.37 |
| Daily Pivot Point S3 | 127.71 |
| Daily Pivot Point R1 | 130.90 |
| Daily Pivot Point R2 | 131.56 |
| Daily Pivot Point R3 | 132.50 |
[/s2If]
Join Our Telegram Group
")


