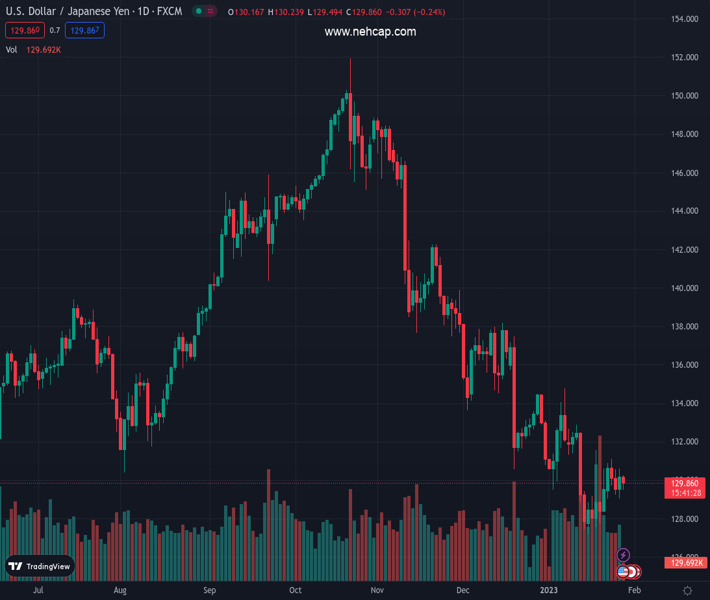
#USDJPY @ 129.862 retreats towards intraday low, reverses the previous day’s corrective bounce. (Pivot Orderbook analysis)
…
This is a premium post.
[s2If !current_user_can(access_s2member_level4)]Please register for PREMIUM VERSION HERE to read full post below containing analysis. In case of any error or you think you are not able to read the full post below, please email us at support#nehcap.com [lwa][/s2If] [s2If current_user_can(access_s2member_level4)]
- USD/JPY retreats towards intraday low, reverses the previous day’s corrective bounce.
- BoJ extends five-year loans against collateral to financial institutions to defend YCC as JGB rallied after Tokyo inflation.
- US Dollar traces firmer yields ahead of US Core PCE Price Index for December.
The pair currently trades last at 129.862.
The previous day high was 130.62 while the previous day low was 129.02. The daily 38.2% Fib levels comes at 130.01, expected to provide resistance. Similarly, the daily 61.8% fib level is at 129.63, expected to provide support.
USD/JPY prints mild losses around 130.00, after a failed attempt to recover, as the Bank of Japan (BoJ) marks a show of Yield Curve Control (YCC) during early Friday morning in Europe. In doing so, the Japanese central bank extends five-year loans against collateral to financial institutions, from February 01, 2023, to 2028.
The BoJ activity could be linked to a jump in the 10-year Japanese government bond (JGB) yield to 0.50% after Tokyo Consumer Price Index (CPI) refreshed a 42-year high of 4.3% for January.
It’s worth noting that this is the BoJ’s second attempt in January to defend the YCC policy, which in turn suggests further challenges for the ultra-loose monetary policy of the Japanese central bank.
Contrary to the BoJ action, a run-up in the US 10-year Treasury bond yields and the market’s rush towards risk-safety, mainly after Thursday’s upbeat US growth numbers, challenges the USD/JPY bears. On the same line could be the cautious mood ahead of the Federal Reserve’s (Fed) favorite inflation number, namely the US Core Personal Consumption Expenditures (PCE) – Price Index for December, expected to remain unchanged at 0.2% MoM.
Against this backdrop, the US 10-year Treasury yields extend the previous day’s recovery to 3.52% while the S&P 500 Futures print mild losses. That said, Japan’s Nikkei 225 drops 0.12% on a day as it snaps a five-day uptrend.
Looking forward, the US Core PCE data will be crucial for the USD/JPY pair as the Fed is ready to announce another 0.25% rate hike in the next week. It should be noted that the downbeat US inflation precursor could confirm the market’s dovish expectations from the US central bank and may exert more downside pressure on the Yen pair.
Also read: US December PCE Inflation Preview: Is there room for further US Dollar weakness?
Multiple failures to cross the 21-DMA surrounding 130.00 keeps pushing USD/JPY down even as a fortnight-old support line, close to 128.80 at the latest.
Technical Levels: Supports and Resistances
USDJPY currently trading at 129.95 at the time of writing. Pair opened at 130.25 and is trading with a change of -0.23% % .
| Overview | Overview.1 | |
|---|---|---|
| 0 | Today last price | 129.95 |
| 1 | Today Daily Change | -0.30 |
| 2 | Today Daily Change % | -0.23% |
| 3 | Today daily open | 130.25 |
The pair remains strongly bearish on the daily time frame. It trades below the 20 SMA @ 130.45, 50 SMA 134.04, 100 SMA @ 139.59 and 200 SMA @ 136.76.
| Trends | Trends.1 | |
|---|---|---|
| 0 | Daily SMA20 | 130.45 |
| 1 | Daily SMA50 | 134.04 |
| 2 | Daily SMA100 | 139.59 |
| 3 | Daily SMA200 | 136.76 |
The previous day high was 130.62 while the previous day low was 129.02. The daily 38.2% Fib levels comes at 130.01, expected to provide resistance. Similarly, the daily 61.8% fib level is at 129.63, expected to provide support.
Note the levels of interest below:
- Pivot support is noted at 129.31, 128.37, 127.71
- Pivot resistance is noted at 130.9, 131.56, 132.5
| Levels | Levels.1 |
|---|---|
| Previous Daily High | 130.62 |
| Previous Daily Low | 129.02 |
| Previous Weekly High | 131.58 |
| Previous Weekly Low | 127.22 |
| Previous Monthly High | 138.18 |
| Previous Monthly Low | 130.57 |
| Daily Fibonacci 38.2% | 130.01 |
| Daily Fibonacci 61.8% | 129.63 |
| Daily Pivot Point S1 | 129.31 |
| Daily Pivot Point S2 | 128.37 |
| Daily Pivot Point S3 | 127.71 |
| Daily Pivot Point R1 | 130.90 |
| Daily Pivot Point R2 | 131.56 |
| Daily Pivot Point R3 | 132.50 |
[/s2If]
Join Our Telegram Group
")


