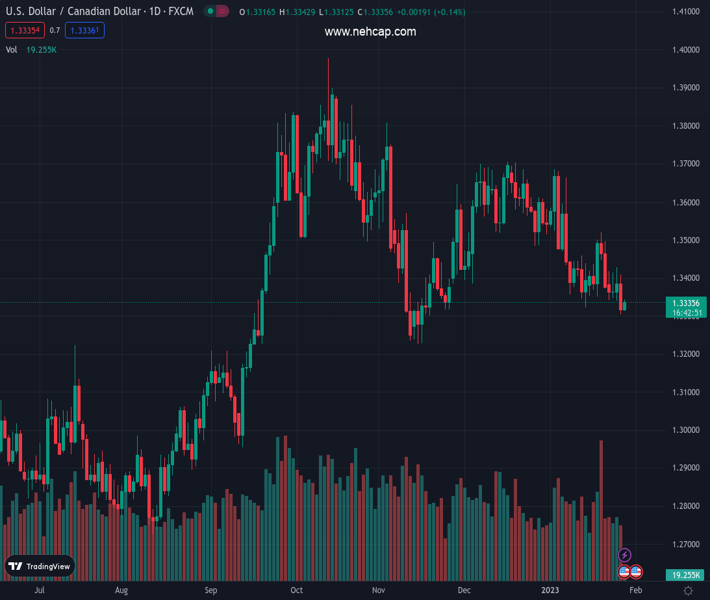
#USDCAD @ 1.33355 portrays corrective bounce from seven-month-old ascending support line., @nehcap view: Limited recovery expected (Pivot Orderbook analysis)
…
This is a premium post.
[s2If !current_user_can(access_s2member_level4)]Please register for PREMIUM VERSION HERE to read full post below containing analysis. In case of any error or you think you are not able to read the full post below, please email us at support#nehcap.com [lwa][/s2If] [s2If current_user_can(access_s2member_level4)]
- USD/CAD portrays corrective bounce from seven-month-old ascending support line.
- Downbeat oscillators, 38.2% Fibonacci retracement and previous support line guards recovery moves.
- 100-DMA holds the key to buyer’s conviction while break of 1.3300 could aim for 200-DMA.
The pair currently trades last at 1.33355.
The previous day high was 1.3408 while the previous day low was 1.3303. The daily 38.2% Fib levels comes at 1.3343, expected to provide resistance. Similarly, the daily 61.8% fib level is at 1.3368, expected to provide resistance.
USD/CAD picks up bids to pare recent losses around the lowest levels in 11 weeks, mildly bid near 1.3340 heading into Friday’s European session. In doing so, the Loonie pair bounces off an upward-sloping support line from early June 2022.
However, a convergence of the previous support line from mid-November and the 38.2% Fibonacci retracement level of the pair’s April-October upside, near 1.3380 by the press time, restricts USD/CAD pair’s recovery.
Other than the aforementioned key resistance confluence near 1.3380, the bearish MACD signals and the downward-sloping RSI (14) also challenge the Loonie pair’s corrective bounce.
Even if the USD/CAD buyers manage to cross the 1.3380 hurdle, the 100-DMA surrounding 1.3525 will be crucial to stop the upside momentum, a break of which won’t hesitate to challenge the monthly high of near 1.3685.
On the flip side, a daily closing below the stated multi-month-old support line, close to 1.3300 at the latest, could quickly fetch the USD/CAD pair towards the 200-DMA support of around 1.3210.
In a case where the USD/CAD remains bearish past 1.3210, the 1.3200 round figure may act as the last defense of buyers before relinquishing control.
Trend: Limited recovery expected
Technical Levels: Supports and Resistances
USDCAD currently trading at 1.3339 at the time of writing. Pair opened at 1.3324 and is trading with a change of 0.11% % .
| Overview | Overview.1 | |
|---|---|---|
| 0 | Today last price | 1.3339 |
| 1 | Today Daily Change | 0.0015 |
| 2 | Today Daily Change % | 0.11% |
| 3 | Today daily open | 1.3324 |
The pair is trading below its 20 Daily moving average @ 1.3445, below its 50 Daily moving average @ 1.3504 , below its 100 Daily moving average @ 1.3522 and above its 200 Daily moving average @ 1.3205
| Trends | Trends.1 | |
|---|---|---|
| 0 | Daily SMA20 | 1.3445 |
| 1 | Daily SMA50 | 1.3504 |
| 2 | Daily SMA100 | 1.3522 |
| 3 | Daily SMA200 | 1.3205 |
The previous day high was 1.3408 while the previous day low was 1.3303. The daily 38.2% Fib levels comes at 1.3343, expected to provide resistance. Similarly, the daily 61.8% fib level is at 1.3368, expected to provide resistance.
Note the levels of interest below:
- Pivot support is noted at 1.3282, 1.324, 1.3178
- Pivot resistance is noted at 1.3387, 1.345, 1.3492
| Levels | Levels.1 |
|---|---|
| Previous Daily High | 1.3408 |
| Previous Daily Low | 1.3303 |
| Previous Weekly High | 1.3521 |
| Previous Weekly Low | 1.3351 |
| Previous Monthly High | 1.3705 |
| Previous Monthly Low | 1.3385 |
| Daily Fibonacci 38.2% | 1.3343 |
| Daily Fibonacci 61.8% | 1.3368 |
| Daily Pivot Point S1 | 1.3282 |
| Daily Pivot Point S2 | 1.3240 |
| Daily Pivot Point S3 | 1.3178 |
| Daily Pivot Point R1 | 1.3387 |
| Daily Pivot Point R2 | 1.3450 |
| Daily Pivot Point R3 | 1.3492 |
[/s2If]
Join Our Telegram Group
")


