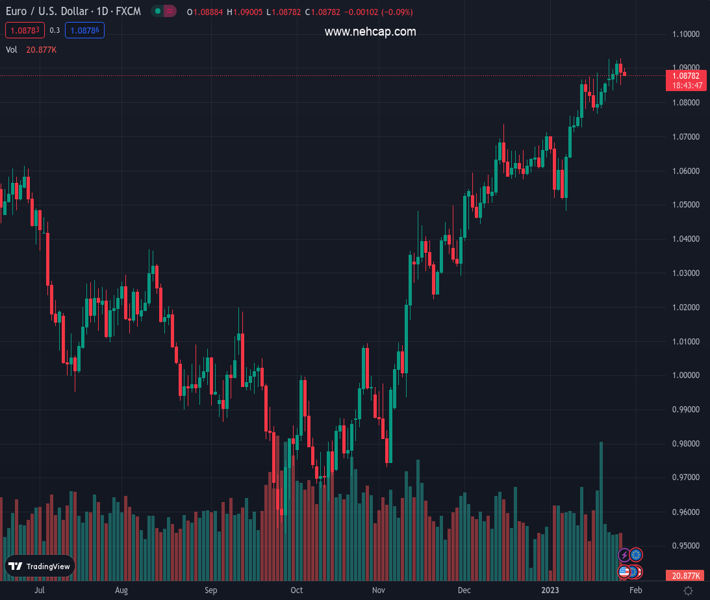
#EURUSD @ 1.08790 takes offers to refresh intraday low, extend the previous day’s pullback from nine-month high. (Pivot Orderbook analysis)
…
This is a premium post.
[s2If !current_user_can(access_s2member_level4)]Please register for PREMIUM VERSION HERE to read full post below containing analysis. In case of any error or you think you are not able to read the full post below, please email us at support#nehcap.com [lwa][/s2If] [s2If current_user_can(access_s2member_level4)]
- EUR/USD takes offers to refresh intraday low, extend the previous day’s pullback from nine-month high.
- US data flashed mixed signals but rebound in Treasury bond yields puts a floor under US Dollar.
- Absence of ECB speak, cautious sentiment ahead of the key US data exerts downside pressure on Euro pair.
The pair currently trades last at 1.08790.
The previous day high was 1.093 while the previous day low was 1.085. The daily 38.2% Fib levels comes at 1.0881, expected to provide resistance. Similarly, the daily 61.8% fib level is at 1.0899, expected to provide resistance.
EUR/USD holds lower grounds for the second consecutive day as the US Dollar consolidates weekly losses ahead of the Federal Reserve’s (Fed) favorite inflation number during early Friday. That said, the Euro pair renews its intraday low to around 1.0880 while extending the previous day’s pullback from the highest levels since April 2022.
US Dollar Index (DXY) picks up bids to 101.85 as it stretches the late Thursday‘s rebound after the upbeat prints of the US fourth-quarter (Q4) Annualized Gross Domestic Product (GDP), to 2.9% versus 2.6% expected and 3.2% prior. That said, the US 10-year and two-year Treasury bond yields also print the two-day uptrend around 3.51% and 4.19% respectively by the press time.
It should be noted that the downbeat prints of the US Personal Consumption Expenditures (PCE) details challenged the hawkish Fed concerns afterward and probe the EUR/USD bears. On the same line, comments favoring the European Central Bank’s (ECB) 0.50% rate hike ahead of the pre-meeting silence period also put a floor under the Euro pair.
On a different page, hopes of avoiding the US debt ceiling expiry, backed by the House Republicans’ readiness to push it back to September, seem to weigh on the EUR/USD price.
Against this backdrop, the S&P 500 Futures print mild losses while ignoring Wall Street’s gains.
Looking forward, the lack of clarity from the US data joins the hawkish concerns from the ECB to keep EUR/USD buyers hopeful unless the US Core PCE – Price Index for December, expected to remain unchanged at 0.2% MoM, flashes extremely downbeat figures.
Also read: US December PCE Inflation Preview: Is there room for further US Dollar weakness?
Although a two-week-old bullish channel keeps EUR/USD buyers hopeful, a retreat by the RSI (14) line from overbought territory signals further downside toward the 10-DMA support near 1.0850.
Technical Levels: Supports and Resistances
EURUSD currently trading at 1.088 at the time of writing. Pair opened at 1.0892 and is trading with a change of -0.11% % .
| Overview | Overview.1 | |
|---|---|---|
| 0 | Today last price | 1.088 |
| 1 | Today Daily Change | -0.0012 |
| 2 | Today Daily Change % | -0.11% |
| 3 | Today daily open | 1.0892 |
The pair remains strongly bullish on the daily timeframe. It trades above its 20 SMA @ 1.0762, 50 SMA 1.0613, 100 SMA @ 1.0269 and 200 SMA @ 1.0311.
| Trends | Trends.1 | |
|---|---|---|
| 0 | Daily SMA20 | 1.0762 |
| 1 | Daily SMA50 | 1.0613 |
| 2 | Daily SMA100 | 1.0269 |
| 3 | Daily SMA200 | 1.0311 |
The previous day high was 1.093 while the previous day low was 1.085. The daily 38.2% Fib levels comes at 1.0881, expected to provide resistance. Similarly, the daily 61.8% fib level is at 1.0899, expected to provide resistance.
Note the levels of interest below:
- Pivot support is noted at 1.0852, 1.0812, 1.0773
- Pivot resistance is noted at 1.0931, 1.097, 1.101
| Levels | Levels.1 |
|---|---|
| Previous Daily High | 1.0930 |
| Previous Daily Low | 1.0850 |
| Previous Weekly High | 1.0888 |
| Previous Weekly Low | 1.0766 |
| Previous Monthly High | 1.0736 |
| Previous Monthly Low | 1.0393 |
| Daily Fibonacci 38.2% | 1.0881 |
| Daily Fibonacci 61.8% | 1.0899 |
| Daily Pivot Point S1 | 1.0852 |
| Daily Pivot Point S2 | 1.0812 |
| Daily Pivot Point S3 | 1.0773 |
| Daily Pivot Point R1 | 1.0931 |
| Daily Pivot Point R2 | 1.0970 |
| Daily Pivot Point R3 | 1.1010 |
[/s2If]
Join Our Telegram Group
")


