#AUDUSD @ 0.71049 struggles to gain any meaningful traction and remains confined in a range. (Pivot Orderbook analysis)
…
This is a premium post.
[s2If !current_user_can(access_s2member_level4)]Please register for PREMIUM VERSION HERE to read full post below containing analysis. In case of any error or you think you are not able to read the full post below, please email us at support#nehcap.com [lwa][/s2If] [s2If current_user_can(access_s2member_level4)]
- AUD/USD struggles to gain any meaningful traction and remains confined in a range.
- A combination of factors revives the USD demand and acts as a headwind for the pair.
- Bets for additional RBA rate hikes lend support ahead of the key US PCE Price Index.
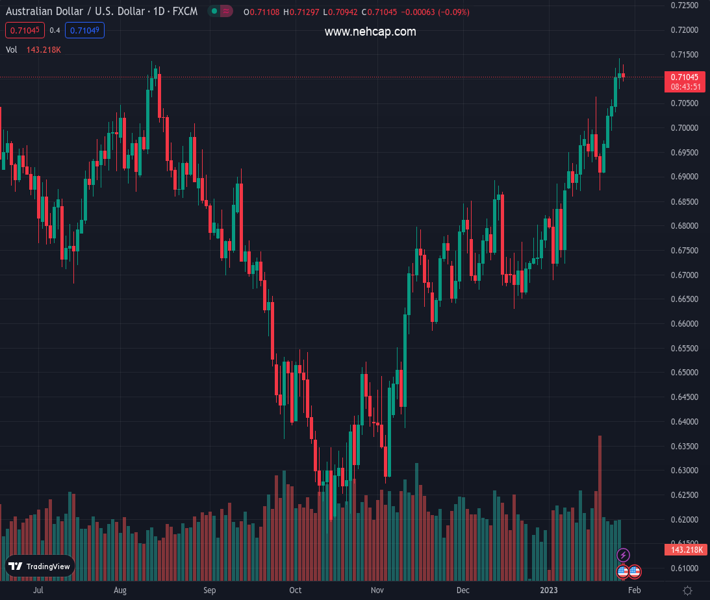
The pair currently trades last at 0.71049.
The previous day high was 0.7143 while the previous day low was 0.7079. The daily 38.2% Fib levels comes at 0.7118, expected to provide resistance. Similarly, the daily 61.8% fib level is at 0.7103, expected to provide support.
The AUD/USD pair is seen oscillating in a narrow trading band on Friday and consolidating its recent strong gains to the highest level since June 2022 touched the previous day. The pair is currently placed around the 0.7100 mark, nearly unchanged for the day, as traders look to the key US macro data for a fresh impetus.
The Fed’s preferred inflation gauge – the Core PCE Price Index – is due for release in a short while from now. This might influence the US central bank’s rate hike path, which, in turn, will drive the US Dollar demand and provide a fresh directional impetus to the AUD/USD pair. In the meantime, a goodish pickup in the US Treasury bond yields lends some support to the buck. Apart from this, the prevalent cautious market mood further benefits the greenback’s relative safe-haven status and caps the upside for the risk-sensitive Aussie.
The modest intraday USD, however, lacks bullish conviction amid the prospects for a less aggressive policy tightening by the Fed. In fact, the markets are still pricing in a smaller 25 bps Fed rate hike move in February, which, in turn, keeps a lid on any meaningful upside for the greenback. Apart from this, rising odds for an additional rate hike by the Reserve Bank of Australia (RBA) in February, bolstered by the stronger domestic CPI report on Wednesday, underpin the domestic currency and acts as a tailwind for the AUD/USD pair.
Friday’s US economic docket also features the release of Pending Home Sales data and the revised Michigan Consumer Sentiment Index. This, along with the US bond yields and the broader market risk sentiment, might influence the USD price dynamics and provide some impetus to the AUD/USD pair. The focus, however, will remain glued to the outcome of a two-day FOMC monetary policy meeting, scheduled to be announced next Wednesday. Heading into the key event risk, the major is more likely to prolong its consolidative price move.
Technical Levels: Supports and Resistances
AUDUSD currently trading at 0.7103 at the time of writing. Pair opened at 0.7116 and is trading with a change of -0.18 % .
| Overview | Overview.1 | |
|---|---|---|
| 0 | Today last price | 0.7103 |
| 1 | Today Daily Change | -0.0013 |
| 2 | Today Daily Change % | -0.1800 |
| 3 | Today daily open | 0.7116 |
The pair remains strongly bullish on the daily timeframe. It trades above its 20 SMA @ 0.6926, 50 SMA 0.6808, 100 SMA @ 0.6653 and 200 SMA @ 0.6813.
| Trends | Trends.1 | |
|---|---|---|
| 0 | Daily SMA20 | 0.6926 |
| 1 | Daily SMA50 | 0.6808 |
| 2 | Daily SMA100 | 0.6653 |
| 3 | Daily SMA200 | 0.6813 |
The previous day high was 0.7143 while the previous day low was 0.7079. The daily 38.2% Fib levels comes at 0.7118, expected to provide resistance. Similarly, the daily 61.8% fib level is at 0.7103, expected to provide support.
Note the levels of interest below:
- Pivot support is noted at 0.7083, 0.705, 0.702
- Pivot resistance is noted at 0.7146, 0.7176, 0.7209
| Levels | Levels.1 |
|---|---|
| Previous Daily High | 0.7143 |
| Previous Daily Low | 0.7079 |
| Previous Weekly High | 0.7064 |
| Previous Weekly Low | 0.6872 |
| Previous Monthly High | 0.6893 |
| Previous Monthly Low | 0.6629 |
| Daily Fibonacci 38.2% | 0.7118 |
| Daily Fibonacci 61.8% | 0.7103 |
| Daily Pivot Point S1 | 0.7083 |
| Daily Pivot Point S2 | 0.7050 |
| Daily Pivot Point S3 | 0.7020 |
| Daily Pivot Point R1 | 0.7146 |
| Daily Pivot Point R2 | 0.7176 |
| Daily Pivot Point R3 | 0.7209 |
[/s2If]
Join Our Telegram Group
")


