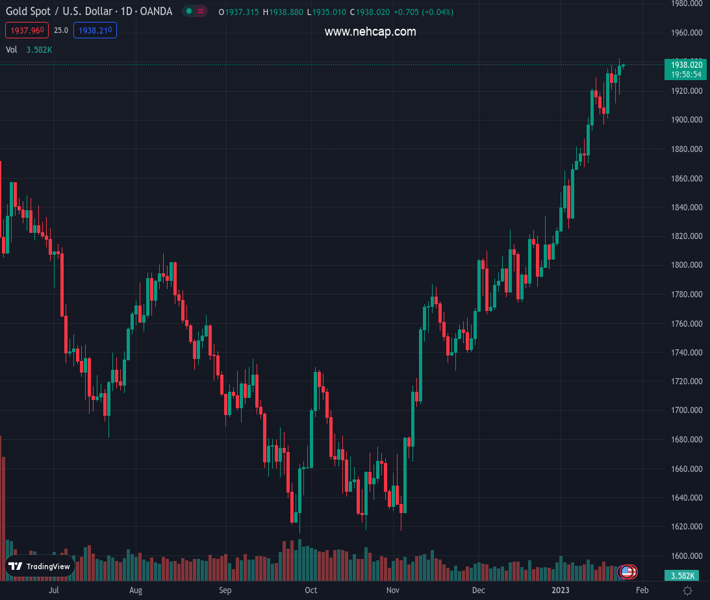
#XAUUSD @ 1,937.49 Gold price is attempting to surpass $1,940.00 as US yields drop further. (Pivot Orderbook analysis)
…
This is a premium post.
[s2If !current_user_can(access_s2member_level4)]Please register for PREMIUM VERSION HERE to read full post below containing analysis. In case of any error or you think you are not able to read the full post below, please email us at support#nehcap.com [lwa][/s2If] [s2If current_user_can(access_s2member_level4)]
- Gold price is attempting to surpass $1,940.00 as US yields drop further.
- The USD Index to remain weak this year as attention is turning towards policy tightening in other advanced economies.
- Gold price is auctioning in a Rising Wedge, portraying a volatility contraction.
The pair currently trades last at 1937.49.
The previous day high was 1942.57 while the previous day low was 1917.19. The daily 38.2% Fib levels comes at 1932.87, expected to provide support. Similarly, the daily 61.8% fib level is at 1926.89, expected to provide support.
Gold price (XAU/USD) is aiming to overstep the immediate resistance of $1,940.00 in the Tokyo session. The precious metal is gaining strength amid rising demand for the US government bonds that have weakened yields further. The 10-year US Treasury yields have dropped to near 3.45%.
A sell-off in the S&P500 futures is indicating that the risk-taking capacity of the market participants is fading away. Missed estimates by tech-giant Microsoft in its December earnings and technical glitch in NYSE are impacting United States equities. The US Dollar Index (DXY) is displaying a sideways profile around 101.50 as investors await US Gross Domestic Product (GDP) data for fresh impetus.
Gold price might find strength if US GDP contracts dramatically, which might further bolster the expectations for a smaller interest rate hike by the Federal Reserve (Fed) in its February meeting. As per the estimates, the annual Q4CY2022 GDP will contract to 2.8% from the former release of 3.2%. For the USD Index outlook, economists at CIBC Capital Markets look for the mighty US Dollar to weaken in 2023 as the Fed is set to undershoot market expectations for the peak fed funds rate, and attention turning to policy tightening in other advanced economies.
Gold price is auctioning in a Rising Wedge chart pattern on an hourly scale that indicates volatility contraction, which will result in wider ticks and heavy volume after an explosion. The 20-period Exponential Moving Average (EMA) at $1,935.33 is acting as a cushion for the Gold bulls.
Meanwhile, the Relative Strength Index (RSI) (14) is oscillating in a 40.00-60.00 range that demonstrates a lackluster performance by the Gold price ahead.
Technical Levels: Supports and Resistances
XAUUSD currently trading at 1938.11 at the time of writing. Pair opened at 1937.95 and is trading with a change of 0.01 % .
| Overview | Overview.1 | |
|---|---|---|
| 0 | Today last price | 1938.11 |
| 1 | Today Daily Change | 0.16 |
| 2 | Today Daily Change % | 0.01 |
| 3 | Today daily open | 1937.95 |
The pair remains strongly bullish on the daily timeframe. It trades above its 20 SMA @ 1878.11, 50 SMA 1818.87, 100 SMA @ 1748.69 and 200 SMA @ 1775.67.
| Trends | Trends.1 | |
|---|---|---|
| 0 | Daily SMA20 | 1878.11 |
| 1 | Daily SMA50 | 1818.87 |
| 2 | Daily SMA100 | 1748.69 |
| 3 | Daily SMA200 | 1775.67 |
The previous day high was 1942.57 while the previous day low was 1917.19. The daily 38.2% Fib levels comes at 1932.87, expected to provide support. Similarly, the daily 61.8% fib level is at 1926.89, expected to provide support.
Note the levels of interest below:
- Pivot support is noted at 1922.57, 1907.19, 1897.19
- Pivot resistance is noted at 1947.95, 1957.95, 1973.33
| Levels | Levels.1 |
|---|---|
| Previous Daily High | 1942.57 |
| Previous Daily Low | 1917.19 |
| Previous Weekly High | 1937.57 |
| Previous Weekly Low | 1896.63 |
| Previous Monthly High | 1833.38 |
| Previous Monthly Low | 1765.89 |
| Daily Fibonacci 38.2% | 1932.87 |
| Daily Fibonacci 61.8% | 1926.89 |
| Daily Pivot Point S1 | 1922.57 |
| Daily Pivot Point S2 | 1907.19 |
| Daily Pivot Point S3 | 1897.19 |
| Daily Pivot Point R1 | 1947.95 |
| Daily Pivot Point R2 | 1957.95 |
| Daily Pivot Point R3 | 1973.33 |
[/s2If]
Join Our Telegram Group
")


