WTI steadies after two-day downtrend, mildly bid of late. (Pivot Orderbook analysis)
…
This is a premium post.
[s2If !current_user_can(access_s2member_level4)]Please register for PREMIUM VERSION HERE to read full post below containing analysis. In case of any error or you think you are not able to read the full post below, please email us at support#nehcap.com [lwa][/s2If] [s2If current_user_can(access_s2member_level4)]
- WTI steadies after two-day downtrend, mildly bid of late.
- Fears of recession joins successive addition in the US inventories, Biden’s push for SPR to weigh on prices.
- OPEC+ chatters add strength to the upside filters.
- Softer US Dollar, China-linked optimism puts a floor under the prices.
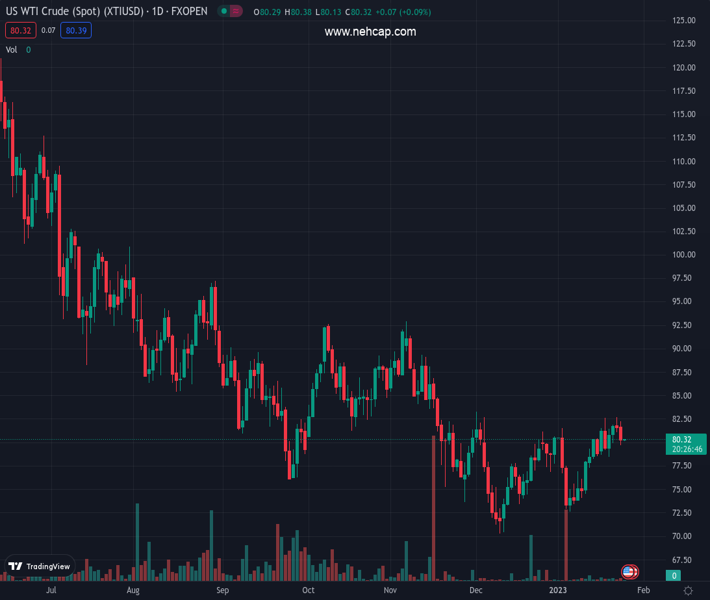
The pair currently trades last at 80.26.
The previous day high was 82.29 while the previous day low was 79.74. The daily 38.2% Fib levels comes at 80.71, expected to provide resistance. Similarly, the daily 61.8% fib level is at 81.32, expected to provide resistance.
WTI crude oil picks up bids to pare the two-day losses around $80.30, printing mild gains during early Wednesday in Asia. In doing so, the black gold prices benefit from the softer US Dollar amid sluggish trading hours. However, economic fears and growing concerns over inventory build, as well as higher supplies, seem to probe the Oil buyers of late.
That said, US Dollar Index (DXY) remains pressured after the January activity data suggests the contraction despite being in contraction region. January’s US S&P Global Composite PMI for increased to 46.6 from 45.0 prior and the 44.7 consensus, marking the seventh consecutive read below 50. It’s worth observing that preliminary readings of the US S&P Global Manufacturing PMI for January rose past 46.2 market forecast and 46.1 market expectations with 46.8 figure while the Services PMI followed the suit with the 46.6 figure for the said month, versus 44.5 forecast and 44.7 prior.
On the other hand, the American Petroleum Institute’s (API) weekly US Crude Oil Stock report for the week ended on January 20 showed the addition of 3.378 million barrels versus 7.615M prior increase. With this, the API stockpiles grew for the fourth consecutive week.
It should be noted that the US activity numbers weren’t the only one which were softer, the figures from Germany also couldn’t impress the oil buyers.
Also challenging the energy benchmark prices could be the latest tension surrounding US and Chinese ties due to Beijing-based companies’ alleged role in the Russian war. On the same line could be US President Joe Biden’s readiness to use the US Strategic Petroleum Reserves (SPR) and using veto rights to defend the action in case needed.
Additionally, Reuters came out with news suggesting no major change in the OPEC+ output policy while citing an anonymous source. “The Joint Ministerial Monitoring Committee (JMMC) of the Organization of the Petroleum Exporting Countries (OPEC) and allies led by Russia, known collectively as OPEC+, is unlikely to recommend any changes to oil output policy,” said Reuters citing five OPEC+ sources. OPEC+ is scheduled to meet next week, on February 1.
Looking forward, the official weekly Crude Oil Stocks Change report from the Energy Information Administration (EIA) for the week ended on January 20, prior 8.408M, will be watched closely for confirmation of the API data.
A failure to cross the 100-DMA hurdle, around $81.70 by the press time, highlights three-week-old support line, close to $79.50 by the press time, as the key support to watch.
Technical Levels: Supports and Resistances
XTIUSD currently trading at 80.26 at the time of writing. Pair opened at 80.18 and is trading with a change of 0.10% % .
| Overview | Overview.1 | |
|---|---|---|
| 0 | Today last price | 80.26 |
| 1 | Today Daily Change | 0.08 |
| 2 | Today Daily Change % | 0.10% |
| 3 | Today daily open | 80.18 |
The pair is trading above its 20 Daily moving average @ 78.4, above its 50 Daily moving average @ 77.95 , below its 100 Daily moving average @ 81.7 and below its 200 Daily moving average @ 91.73
| Trends | Trends.1 | |
|---|---|---|
| 0 | Daily SMA20 | 78.40 |
| 1 | Daily SMA50 | 77.95 |
| 2 | Daily SMA100 | 81.70 |
| 3 | Daily SMA200 | 91.73 |
The previous day high was 82.29 while the previous day low was 79.74. The daily 38.2% Fib levels comes at 80.71, expected to provide resistance. Similarly, the daily 61.8% fib level is at 81.32, expected to provide resistance.
Note the levels of interest below:
- Pivot support is noted at 79.18, 78.19, 76.63
- Pivot resistance is noted at 81.73, 83.29, 84.28
| Levels | Levels.1 |
|---|---|
| Previous Daily High | 82.29 |
| Previous Daily Low | 79.74 |
| Previous Weekly High | 82.67 |
| Previous Weekly Low | 78.48 |
| Previous Monthly High | 83.30 |
| Previous Monthly Low | 70.27 |
| Daily Fibonacci 38.2% | 80.71 |
| Daily Fibonacci 61.8% | 81.32 |
| Daily Pivot Point S1 | 79.18 |
| Daily Pivot Point S2 | 78.19 |
| Daily Pivot Point S3 | 76.63 |
| Daily Pivot Point R1 | 81.73 |
| Daily Pivot Point R2 | 83.29 |
| Daily Pivot Point R3 | 84.28 |
[/s2If]
Join Our Telegram Group
")


