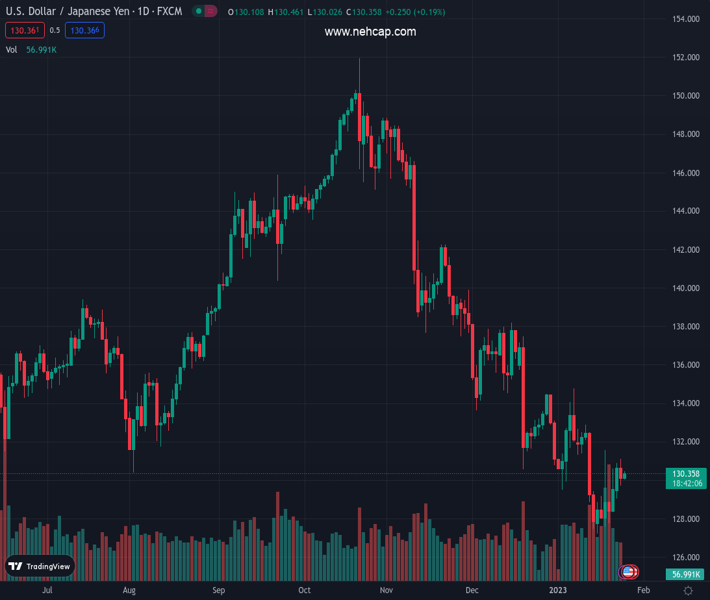
#USDJPY @ 130.363 prints mild gains after reversing from weekly top the previous day. (Pivot Orderbook analysis)
…
This is a premium post.
[s2If !current_user_can(access_s2member_level4)]Please register for PREMIUM VERSION HERE to read full post below containing analysis. In case of any error or you think you are not able to read the full post below, please email us at support#nehcap.com [lwa][/s2If] [s2If current_user_can(access_s2member_level4)]
- USD/JPY prints mild gains after reversing from weekly top the previous day.
- Yields remain sidelined as traders await more clarity on growth prospects, Fed moves.
- US PMIs were mixed but downbeat equities and higher prints of inflation data elsewhere allowed yields/USD to defend Yen buyers.
- Light calendar ahead of US GDP, FOMC restricts immediate moves.
The pair currently trades last at 130.363.
The previous day high was 131.12 while the previous day low was 129.73. The daily 38.2% Fib levels comes at 130.26, expected to provide support. Similarly, the daily 61.8% fib level is at 130.58, expected to provide resistance.
USD/JPY floats above 130.00, printing mild gains around 130.30 by the press time, amid sluggish markets on early Wednesday. In doing so, the Yen pair takes clues from the inactive Treasury bond yields amid a lack of data/events at home. Also likely to restrict the quote’s immediate moves could be the market’s cautious mood ahead of the Bank of Japan’s (BOJ) Summary of Opinions and US Gross Domestic Product (GDP) for the fourth quarter (Q4), not to forget the next week’s Federal Open Market Committee (FOMC) meeting.
That said, the US 10-year Treasury bond yields drop 1.5 basis points (bps) to 3.45% while the two-year counterpart posted the biggest daily loss in a week around the 4.15% level. It should be noted that the S&P 500 Futures drop half a percent to 4,012, extending the previous day’s U-turn from the 1.5-month high.
While Wall Street’s mixed closing and the US Dollar’s failure to cheer the improvement in January PMI underpin USD/JPY weakness, together with hawkish bias from the BoJ, the market’s preparations for the next week’s Fed meeting propel the Yen pair.
It should be noted that Tuesday’s technical glitch joined the mixed earnings report to confuse equity traders the previous day. “Fourth quarter earnings season is in full swing, with 72 of the companies in the S&P 500 having reported. Of those, 65% have beaten consensus, just a hair below the 66% long-term average, according to Refinitiv,” said Reuters.
On the other hand, the US Dollar Index (DXY) remains pressured as the US activity data for January remained below 50.0 level and suggested contraction despite improving a bit.
The US PMIs moderated in the last few months but the growth is yet to witness as January’s US S&P Global Composite PMI for January increased to 46.6 from 45.0 prior and the 44.7 consensus, marking the seventh consecutive read below 50. It’s worth observing that preliminary readings of the US S&P Global Manufacturing PMI for January rose past 46.2 market forecast and 46.1 market expectations with 46.8 figure while the Services PMI followed the suit with the 46.6 figure for the said month, versus 44.5 forecast and 44.7 prior.
Amid these plays, Fed fund futures signal the market’s receding hawkish bias. “Fed fund futures see only two more quarter-point rate hikes by the Fed to a peak of around 5% by June, before it starts cutting rates later in the year. The Federal Reserve itself has insisted it still has 75 bps of increases in the pipeline,” said Reuters.
To sum up, USD/JPY portrays the typical pre-data anxiety while defending the 130.00 round figure. However, bears have an upper hand considering the hawkish bias surrounding BoJ.
A two-month-old bearish channel restricts USD/JPY moves between 132.00 and 125.90.
Technical Levels: Supports and Resistances
USDJPY currently trading at 130.32 at the time of writing. Pair opened at 130.16 and is trading with a change of 0.12% % .
| Overview | Overview.1 | |
|---|---|---|
| 0 | Today last price | 130.32 |
| 1 | Today Daily Change | 0.16 |
| 2 | Today Daily Change % | 0.12% |
| 3 | Today daily open | 130.16 |
The pair remains strongly bearish on the daily time frame. It trades below the 20 SMA @ 130.84, 50 SMA 134.44, 100 SMA @ 139.87 and 200 SMA @ 136.74.
| Trends | Trends.1 | |
|---|---|---|
| 0 | Daily SMA20 | 130.84 |
| 1 | Daily SMA50 | 134.44 |
| 2 | Daily SMA100 | 139.87 |
| 3 | Daily SMA200 | 136.74 |
The previous day high was 131.12 while the previous day low was 129.73. The daily 38.2% Fib levels comes at 130.26, expected to provide support. Similarly, the daily 61.8% fib level is at 130.58, expected to provide resistance.
Note the levels of interest below:
- Pivot support is noted at 129.55, 128.94, 128.16
- Pivot resistance is noted at 130.94, 131.72, 132.33
| Levels | Levels.1 |
|---|---|
| Previous Daily High | 131.12 |
| Previous Daily Low | 129.73 |
| Previous Weekly High | 131.58 |
| Previous Weekly Low | 127.22 |
| Previous Monthly High | 138.18 |
| Previous Monthly Low | 130.57 |
| Daily Fibonacci 38.2% | 130.26 |
| Daily Fibonacci 61.8% | 130.58 |
| Daily Pivot Point S1 | 129.55 |
| Daily Pivot Point S2 | 128.94 |
| Daily Pivot Point S3 | 128.16 |
| Daily Pivot Point R1 | 130.94 |
| Daily Pivot Point R2 | 131.72 |
| Daily Pivot Point R3 | 132.33 |
[/s2If]
Join Our Telegram Group
")


