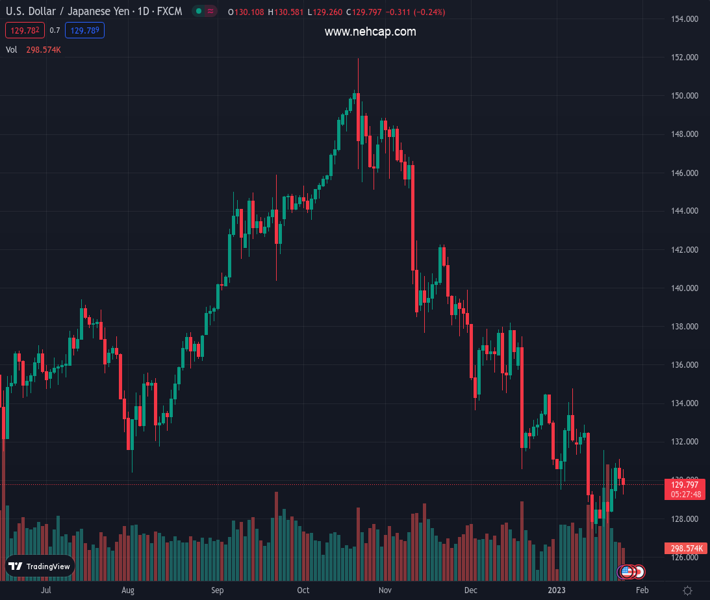
#USDJPY @ 129.819 remained pressured as the 50-DMA crossed beneath the 200-DMA. (Pivot Orderbook analysis)
…
This is a premium post.
[s2If !current_user_can(access_s2member_level4)]Please register for PREMIUM VERSION HERE to read full post below containing analysis. In case of any error or you think you are not able to read the full post below, please email us at support#nehcap.com [lwa][/s2If] [s2If current_user_can(access_s2member_level4)]
- USD/JPY remained pressured as the 50-DMA crossed beneath the 200-DMA.
- Bears stepped in and reclaimed 130.00, as they eye 129.00.
The pair currently trades last at 129.819.
The previous day high was 131.12 while the previous day low was 129.73. The daily 38.2% Fib levels comes at 130.26, expected to provide resistance. Similarly, the daily 61.8% fib level is at 130.58, expected to provide resistance.
USD/JPY fell as the North American session progressed and tumbled below the 130.00 figure, as buyers failed to crack the 20-day Exponential Moving Average (EMA) at 130.74. Factors like a soft US Dollar (USD) and falling US Treasury bond yields are two fundamental reasons for renewed Japanese Yen (JPY) strength. At the time of writing, the USD/JPY is trading at 129.77.
Tuesday’s session was characterized by the USD/JPY reaching a weekly high at 131.11, slightly above the 20-day EMA, but dropped to 130.10. Today, the USD/JPY hit a daily high of 130.58 but extended its losses, while the 50-day Exponential Moving Average (EMA) crossed beneath the 200-day EMA, meaning a death cross emerged in the daily, suggesting that further downside is expected.
Oscillators like the Relative Strength Index (RSI) and the Rate of Change (RoC) aim downwards, supporting lower prices.
Therefore, the USD/JPY first support would be the day’s low of 129.26. Break below will expose the 129.00 psychological level, followed by the January 20 swing low at 128.34 and the YTD low of 127.21. As an alternate scenario, if the USD/JPY reclaims 130.00, the pair could challenge the 20-day EMA.
Technical Levels: Supports and Resistances
USDJPY currently trading at 129.83 at the time of writing. Pair opened at 130.16 and is trading with a change of -0.25 % .
| Overview | Overview.1 | |
|---|---|---|
| 0 | Today last price | 129.83 |
| 1 | Today Daily Change | -0.33 |
| 2 | Today Daily Change % | -0.25 |
| 3 | Today daily open | 130.16 |
The pair remains strongly bearish on the daily time frame. It trades below the 20 SMA @ 130.84, 50 SMA 134.44, 100 SMA @ 139.87 and 200 SMA @ 136.74.
| Trends | Trends.1 | |
|---|---|---|
| 0 | Daily SMA20 | 130.84 |
| 1 | Daily SMA50 | 134.44 |
| 2 | Daily SMA100 | 139.87 |
| 3 | Daily SMA200 | 136.74 |
The previous day high was 131.12 while the previous day low was 129.73. The daily 38.2% Fib levels comes at 130.26, expected to provide resistance. Similarly, the daily 61.8% fib level is at 130.58, expected to provide resistance.
Note the levels of interest below:
- Pivot support is noted at 129.55, 128.94, 128.16
- Pivot resistance is noted at 130.94, 131.72, 132.33
| Levels | Levels.1 |
|---|---|
| Previous Daily High | 131.12 |
| Previous Daily Low | 129.73 |
| Previous Weekly High | 131.58 |
| Previous Weekly Low | 127.22 |
| Previous Monthly High | 138.18 |
| Previous Monthly Low | 130.57 |
| Daily Fibonacci 38.2% | 130.26 |
| Daily Fibonacci 61.8% | 130.58 |
| Daily Pivot Point S1 | 129.55 |
| Daily Pivot Point S2 | 128.94 |
| Daily Pivot Point S3 | 128.16 |
| Daily Pivot Point R1 | 130.94 |
| Daily Pivot Point R2 | 131.72 |
| Daily Pivot Point R3 | 132.33 |
[/s2If]
Join Our Telegram Group
")


