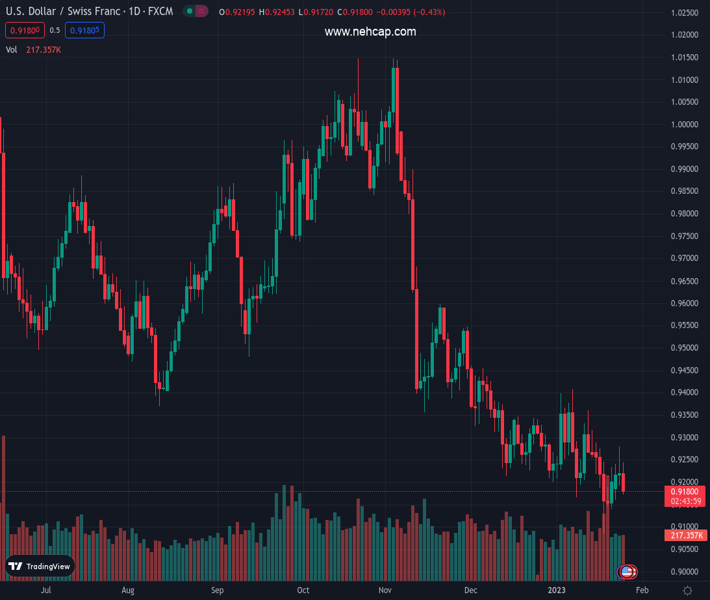
#USDCHF @ 0.91788 bull’s clashed with the 20-day EMA, then jumped from the boat as bears stepped in. (Pivot Orderbook analysis)
…
This is a premium post.
[s2If !current_user_can(access_s2member_level4)]Please register for PREMIUM VERSION HERE to read full post below containing analysis. In case of any error or you think you are not able to read the full post below, please email us at support#nehcap.com [lwa][/s2If] [s2If current_user_can(access_s2member_level4)]
- USD/CHF bull’s clashed with the 20-day EMA, then jumped from the boat as bears stepped in.
- The pair is headed toward the psychological 0.9100, which, once broken, could put the YTD low into play.
- USD/CHF: Failure to register a new YTD low could exacerbate an upward correction.
The pair currently trades last at 0.91788.
The previous day high was 0.928 while the previous day low was 0.9192. The daily 38.2% Fib levels comes at 0.9246, expected to provide resistance. Similarly, the daily 61.8% fib level is at 0.9226, expected to provide resistance.
The USD/CHF battles to break above the 20-day Exponential Moving Average (EMA) and slips beneath 0.9200 to fresh two-day lows at 0.9172 as the US Dollar remains offered in the FX space. Also, a risk-off impulse underpins the safe-haven status of the Swiss franc (CHF). Hence, the USD/CHF exchanges hand at 0.9182 after hitting a daily high of 0.9245.
The USD/CHF continued its downtrend after hitting a weekly high of 0.9297, unable to reclaim 0.9300, which exacerbated the fall below the 20-day EMA at 0.9241. Also, the path for the USD/CHF pair was opened to test the year-to-date (YTD) lows of 0.9085, though initially, it would need to hurdle demand zones in between.
On its way to the YTD lows, the USD/CHF’s first support level would be this week’s low of 0.9159. Break below will expose the January 20 daily low of 0.9141, ahead of the 0.9100 mark. Once that psychological price level gives way, then the YTD low would be in play.
As an alternate scenario, the USD/CHF first resistance would be the 0.9200 figure. Once cleared, then, the USD/CHF could test the 20-day EMA at 0.9241, followed by a two-month-old downslope trendline around 0.9250/60.
Looking ahead, USD/CHF’s failure to test the YTD low could expose the USD/CHF to some buying pressure, as the pair has been bottoming around 0.9085/0.9160 since December 2022.
Technical Levels: Supports and Resistances
USDCHF currently trading at 0.9182 at the time of writing. Pair opened at 0.9228 and is trading with a change of -0.5 % .
| Overview | Overview.1 | |
|---|---|---|
| 0 | Today last price | 0.9182 |
| 1 | Today Daily Change | -0.0046 |
| 2 | Today Daily Change % | -0.5000 |
| 3 | Today daily open | 0.9228 |
The pair remains strongly bearish on the daily time frame. It trades below the 20 SMA @ 0.9253, 50 SMA 0.9336, 100 SMA @ 0.9584 and 200 SMA @ 0.9637.
| Trends | Trends.1 | |
|---|---|---|
| 0 | Daily SMA20 | 0.9253 |
| 1 | Daily SMA50 | 0.9336 |
| 2 | Daily SMA100 | 0.9584 |
| 3 | Daily SMA200 | 0.9637 |
The previous day high was 0.928 while the previous day low was 0.9192. The daily 38.2% Fib levels comes at 0.9246, expected to provide resistance. Similarly, the daily 61.8% fib level is at 0.9226, expected to provide resistance.
Note the levels of interest below:
- Pivot support is noted at 0.9187, 0.9146, 0.91
- Pivot resistance is noted at 0.9274, 0.9321, 0.9362
| Levels | Levels.1 |
|---|---|
| Previous Daily High | 0.9280 |
| Previous Daily Low | 0.9192 |
| Previous Weekly High | 0.9288 |
| Previous Weekly Low | 0.9085 |
| Previous Monthly High | 0.9471 |
| Previous Monthly Low | 0.9201 |
| Daily Fibonacci 38.2% | 0.9246 |
| Daily Fibonacci 61.8% | 0.9226 |
| Daily Pivot Point S1 | 0.9187 |
| Daily Pivot Point S2 | 0.9146 |
| Daily Pivot Point S3 | 0.9100 |
| Daily Pivot Point R1 | 0.9274 |
| Daily Pivot Point R2 | 0.9321 |
| Daily Pivot Point R3 | 0.9362 |
[/s2If]
Join Our Telegram Group
")


