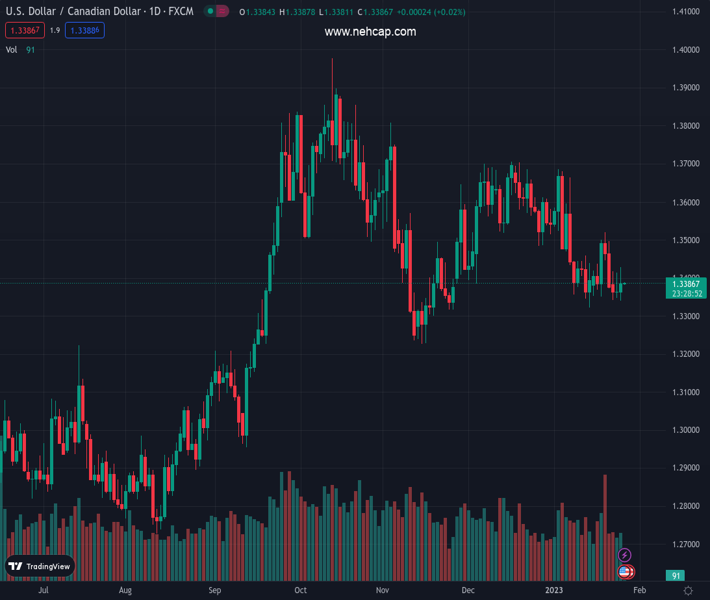
#USDCAD @ 1.33877 picks up bids to reverse post-BoC losses, eyes the first weekly gain in six. (Pivot Orderbook analysis)
…
This is a premium post.
[s2If !current_user_can(access_s2member_level4)]Please register for PREMIUM VERSION HERE to read full post below containing analysis. In case of any error or you think you are not able to read the full post below, please email us at support#nehcap.com [lwa][/s2If] [s2If current_user_can(access_s2member_level4)]
- USD/CAD picks up bids to reverse post-BoC losses, eyes the first weekly gain in six.
- BoC matches market forecasts of 0.25% rate hike but rate outlook, comments from Governor Macklem flashed mixed messages.
- WTI crude oil fails to cheer softer US Dollar, EIA data amid fears of supply increase.
- Slew of US data to entertain Loonie pair traders, advance readings of US Q4 GDP is the key.
The pair currently trades last at 1.33877.
The previous day high was 1.3414 while the previous day low was 1.3347. The daily 38.2% Fib levels comes at 1.3372, expected to provide support. Similarly, the daily 61.8% fib level is at 1.3388, expected to provide resistance.
USD/CAD picks up bids to add to the first weekly gain in six as bulls poke 1.3400 during the early hours of Thursday’s Asian session. In doing so, the Loonie pair consolidates the post-Bank of Canada (BoC) moves amid softer Oil price and a lack of clarity on the BoC’s next moves. Adding strength to the rebound could be the cautious mood ahead of the first readings of the US fourth quarter (Q4) Gross Domestic Product (GDP).
“Prepared to increase policy rate further if needed to return inflation to 2% target; continuing the quantitative tightening program,” mentioned the BoC statement after matching 0.25% rate hike expectations. However, the Canadian central bank also mentioned that it will likely hold rates at this level while assessing the impact of recent policy moves. Following that, BoC Governor Tiff Macklem shrugged off rate cut talks. Hence, mixed signals from the BoC allowed USD/CAD buyers to sneak in even if the central bank becomes the first among the majors to talk about the pause in rate lifts.
On the other hand, WTI crude oil struggles to defend $80.00 amid fears of sustained supply cuts from the global oil producers, as well as the US readiness for more Strategic Petroleum Reserve (SPR) release if needed. On the same line could be the fading of China-linked optimism amid the Lunar New Year (LNY) holidays, as well as a cautious mood ahead of the key data/events. Alternatively, a smaller inventory rise in the US, per the US Energy Information Administration’s (EIA) Crude Oil Stocks Change data for the week ended on January 20, 0.533M versus 0.971M expected and 8.408M prior, as well as the softer US Dollar failed to inspire the energy bulls.
It should be noted that the market sentiment remained dicey amid a light calendar elsewhere and the lack of major macro, amid the China holidays and the Fed blackout. That said, Wall Street closed mixed and the US 10-year Treasury bond yields ended Wednesday with minor moves around 3.45%. However, the US Dollar Index (DXY) remained on the back foot for the third consecutive week.
Having witnessed the BoC-led moves, the USD/CAD traders are likely to witness a volatile day as a slew of US data is up for release. Among them, the first reading of the US Q4 GDP will be crucial amid the recession talks and due to the next week’s Federal Open Market Committee (FOMC) meeting.
Also read: US Gross Domestic Product Preview: Three reasons to expect a US Dollar-boosting outcome
USD/CAD appears clubbed between 10-week-old support and a downward-sloping resistance line from January 06, respectively near 1.3345 and 1.3440.
Technical Levels: Supports and Resistances
USDCAD currently trading at 1.3388 at the time of writing. Pair opened at 1.3372 and is trading with a change of 0.12% % .
| Overview | Overview.1 | |
|---|---|---|
| 0 | Today last price | 1.3388 |
| 1 | Today Daily Change | 0.0016 |
| 2 | Today Daily Change % | 0.12% |
| 3 | Today daily open | 1.3372 |
The pair is trading below its 20 Daily moving average @ 1.3467, below its 50 Daily moving average @ 1.3503 , below its 100 Daily moving average @ 1.3517 and above its 200 Daily moving average @ 1.3197
| Trends | Trends.1 | |
|---|---|---|
| 0 | Daily SMA20 | 1.3467 |
| 1 | Daily SMA50 | 1.3503 |
| 2 | Daily SMA100 | 1.3517 |
| 3 | Daily SMA200 | 1.3197 |
The previous day high was 1.3414 while the previous day low was 1.3347. The daily 38.2% Fib levels comes at 1.3372, expected to provide support. Similarly, the daily 61.8% fib level is at 1.3388, expected to provide resistance.
Note the levels of interest below:
- Pivot support is noted at 1.3341, 1.3311, 1.3275
- Pivot resistance is noted at 1.3408, 1.3444, 1.3475
| Levels | Levels.1 |
|---|---|
| Previous Daily High | 1.3414 |
| Previous Daily Low | 1.3347 |
| Previous Weekly High | 1.3521 |
| Previous Weekly Low | 1.3351 |
| Previous Monthly High | 1.3705 |
| Previous Monthly Low | 1.3385 |
| Daily Fibonacci 38.2% | 1.3372 |
| Daily Fibonacci 61.8% | 1.3388 |
| Daily Pivot Point S1 | 1.3341 |
| Daily Pivot Point S2 | 1.3311 |
| Daily Pivot Point S3 | 1.3275 |
| Daily Pivot Point R1 | 1.3408 |
| Daily Pivot Point R2 | 1.3444 |
| Daily Pivot Point R3 | 1.3475 |
[/s2If]
Join Our Telegram Group
")


