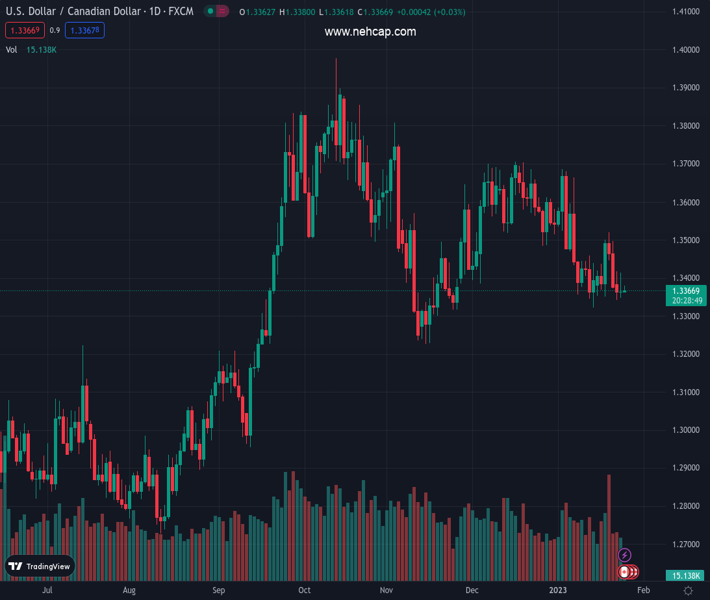
#USDCAD @ 1.33689 is facing stiff resistance in surpassing the 1.3380 hurdle as the focus shifts to BoC policy. (Pivot Orderbook analysis)
…
This is a premium post.
[s2If !current_user_can(access_s2member_level4)]Please register for PREMIUM VERSION HERE to read full post below containing analysis. In case of any error or you think you are not able to read the full post below, please email us at support#nehcap.com [lwa][/s2If] [s2If current_user_can(access_s2member_level4)]
- USD/CAD is facing stiff resistance in surpassing the 1.3380 hurdle as the focus shifts to BoC policy.
- BoC Governor is expected to hike interest rates further by 25 bps to 4.5%.
- A sell-off in S&P500 futures is portraying caution in the market mood.
The pair currently trades last at 1.33689.
The previous day high was 1.3414 while the previous day low was 1.3347. The daily 38.2% Fib levels comes at 1.3372, expected to provide resistance. Similarly, the daily 61.8% fib level is at 1.3388, expected to provide resistance.
The USD/CAD pair is facing barricades in paddling above the immediate resistance of 1.3380 in the Asian session. The Loonie asset is expected to display a volatility contraction as investors are awaiting the interest rate decision by the Bank of Canada (BoC) for fresh cues. To tame the roaring inflation, BoC Governor Tiff Macklem might continue hiking interest rates further.
Meanwhile, S&P500 futures are facing immense sell-off, portraying that investors are getting risk-averse ahead of the release of the United States Gross Domestic Product (GDP) data. The 500-US stock basket futures have dropped sharply amid a decline in investors’ risk appetite. The US Dollar Index (DXY) is building a cushion around 101.50. The 10-year US Treasury yields have dropped below 3.46%.
According to a poll from Reuters, BoC Governor Tiff Macklem’s aggressive policy-tightening campaign is expected to calm as the street sees a further interest rate hike by 25 basis points (bps) to 4.50%. Also, it states that the Canadian central bank will keep interest rates at 4.5% for the rest of the year, which indicates that this might be the end of further policy tightening. Canada’s headline inflation stood at 6.3% for December and is expected to remain above the 2% inflation target till Q3CY2024.
Oil prices have attempted a recovery after dropping to near $80.00 as US President Joe Biden is considering refilling the Strategic Petroleum Reserve (SPR), which was eased to combat mounting oil prices. This might disturb the equilibrium in the demand-supply mechanism, which might result in short-term pain for oil buyers due to higher prices. It is worth noting that Canada is a leading exporter of oil to the United States and a recovery in oil prices will support the Canadian Dollar.
On the United States front, the release of the GDP data might trigger volatility ahead. According to the consensus, the annualized GDP is seen lower at 2.8% vs. the prior release of 3.2%.
Technical Levels: Supports and Resistances
USDCAD currently trading at 1.3369 at the time of writing. Pair opened at 1.3372 and is trading with a change of -0.02 % .
| Overview | Overview.1 | |
|---|---|---|
| 0 | Today last price | 1.3369 |
| 1 | Today Daily Change | -0.0003 |
| 2 | Today Daily Change % | -0.0200 |
| 3 | Today daily open | 1.3372 |
The pair is trading below its 20 Daily moving average @ 1.3467, below its 50 Daily moving average @ 1.3503 , below its 100 Daily moving average @ 1.3517 and above its 200 Daily moving average @ 1.3197
| Trends | Trends.1 | |
|---|---|---|
| 0 | Daily SMA20 | 1.3467 |
| 1 | Daily SMA50 | 1.3503 |
| 2 | Daily SMA100 | 1.3517 |
| 3 | Daily SMA200 | 1.3197 |
The previous day high was 1.3414 while the previous day low was 1.3347. The daily 38.2% Fib levels comes at 1.3372, expected to provide resistance. Similarly, the daily 61.8% fib level is at 1.3388, expected to provide resistance.
Note the levels of interest below:
- Pivot support is noted at 1.3341, 1.3311, 1.3275
- Pivot resistance is noted at 1.3408, 1.3444, 1.3475
| Levels | Levels.1 |
|---|---|
| Previous Daily High | 1.3414 |
| Previous Daily Low | 1.3347 |
| Previous Weekly High | 1.3521 |
| Previous Weekly Low | 1.3351 |
| Previous Monthly High | 1.3705 |
| Previous Monthly Low | 1.3385 |
| Daily Fibonacci 38.2% | 1.3372 |
| Daily Fibonacci 61.8% | 1.3388 |
| Daily Pivot Point S1 | 1.3341 |
| Daily Pivot Point S2 | 1.3311 |
| Daily Pivot Point S3 | 1.3275 |
| Daily Pivot Point R1 | 1.3408 |
| Daily Pivot Point R2 | 1.3444 |
| Daily Pivot Point R3 | 1.3475 |
[/s2If]
Join Our Telegram Group
")


