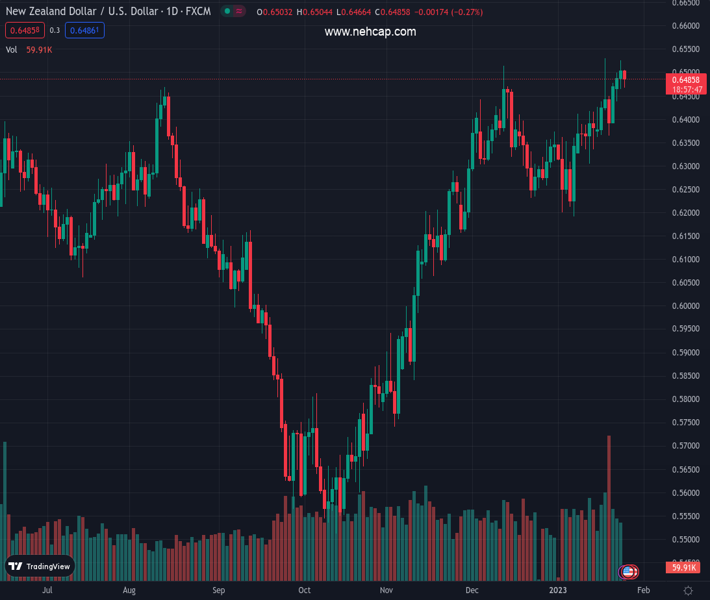
#NZDUSD @ 0.64864 picks up bids to pare intraday losses inside bullish chart formation., @nehcap view: Pullback expected (Pivot Orderbook analysis)
…
This is a premium post.
[s2If !current_user_can(access_s2member_level4)]Please register for PREMIUM VERSION HERE to read full post below containing analysis. In case of any error or you think you are not able to read the full post below, please email us at support#nehcap.com [lwa][/s2If] [s2If current_user_can(access_s2member_level4)]
- NZD/USD picks up bids to pare intraday losses inside bullish chart formation.
- Looming bear cross on MACD, RSI retreat signal further pullback.
- 100-SMA puts a floor under the Kiwi price, bulls can aim for previous yearly top on sustained break of 0.6535.
The pair currently trades last at 0.64864.
The previous day high was 0.6522 while the previous day low was 0.6464. The daily 38.2% Fib levels comes at 0.65, expected to provide resistance. Similarly, the daily 61.8% fib level is at 0.6486, expected to provide support.
NZD/USD licks its wounds near 0.6490 as it pares the intraday loss, the first in four days, during the mid-Asian session on Wednesday. In doing so, the quote justifies the RSI (14) retreat from the overbought territory, as well as the impending bear cross on the MACD.
Even so, the upbeat New Zealand inflation data and a cup-and-handle bullish chart formation on the four-hour play keep the Kiwi pair buyers hopeful.
That said, the quote’s latest weakness remains elusive unless breaking the 100-SMA support of 0.6380.
In a case where the NZD/USD pair drops below 0.6380, the bullish chart formation gets rejection, which in turn can drag the quote toward the monthly low near 0.6190. It should be noted that the 0.6300 round figure may offer an intermediate halt during the fall.
Alternatively, bulls need to portray a successful break of the 0.6535 hurdle to confirm the cup-and-handle chart pattern to theoretically aim for the previous yearly top surrounding 0.7035.
During the anticipated run-up, the mid-2022 peak near 0.6575 may act as buffer while the RSI conditions may challenge the NZD/USD bulls on the way to 0.7035.
Trend: Pullback expected
Technical Levels: Supports and Resistances
NZDUSD currently trading at 0.6488 at the time of writing. Pair opened at 0.6502 and is trading with a change of -0.22% % .
| Overview | Overview.1 | |
|---|---|---|
| 0 | Today last price | 0.6488 |
| 1 | Today Daily Change | -0.0014 |
| 2 | Today Daily Change % | -0.22% |
| 3 | Today daily open | 0.6502 |
The pair remains strongly bullish on the daily timeframe. It trades above its 20 SMA @ 0.6372, 50 SMA 0.6325, 100 SMA @ 0.6073 and 200 SMA @ 0.6198.
| Trends | Trends.1 | |
|---|---|---|
| 0 | Daily SMA20 | 0.6372 |
| 1 | Daily SMA50 | 0.6325 |
| 2 | Daily SMA100 | 0.6073 |
| 3 | Daily SMA200 | 0.6198 |
The previous day high was 0.6522 while the previous day low was 0.6464. The daily 38.2% Fib levels comes at 0.65, expected to provide resistance. Similarly, the daily 61.8% fib level is at 0.6486, expected to provide support.
Note the levels of interest below:
- Pivot support is noted at 0.647, 0.6437, 0.6411
- Pivot resistance is noted at 0.6528, 0.6554, 0.6587
| Levels | Levels.1 |
|---|---|
| Previous Daily High | 0.6522 |
| Previous Daily Low | 0.6464 |
| Previous Weekly High | 0.6531 |
| Previous Weekly Low | 0.6361 |
| Previous Monthly High | 0.6514 |
| Previous Monthly Low | 0.6230 |
| Daily Fibonacci 38.2% | 0.6500 |
| Daily Fibonacci 61.8% | 0.6486 |
| Daily Pivot Point S1 | 0.6470 |
| Daily Pivot Point S2 | 0.6437 |
| Daily Pivot Point S3 | 0.6411 |
| Daily Pivot Point R1 | 0.6528 |
| Daily Pivot Point R2 | 0.6554 |
| Daily Pivot Point R3 | 0.6587 |
[/s2If]
Join Our Telegram Group
")


