#NZDUSD @ 0.64821 meets with some supply in reaction to unimpressive consumer inflation data. (Pivot Orderbook analysis)
…
This is a premium post.
[s2If !current_user_can(access_s2member_level4)]Please register for PREMIUM VERSION HERE to read full post below containing analysis. In case of any error or you think you are not able to read the full post below, please email us at support#nehcap.com [lwa][/s2If] [s2If current_user_can(access_s2member_level4)]
- NZD/USD meets with some supply in reaction to unimpressive consumer inflation data.
- The yearly CPI rate falls short of RBNZ’s forecast and weighs on the domestic currency.
- Subdued USD price action lends some support to the pair and helps limit deeper losses.
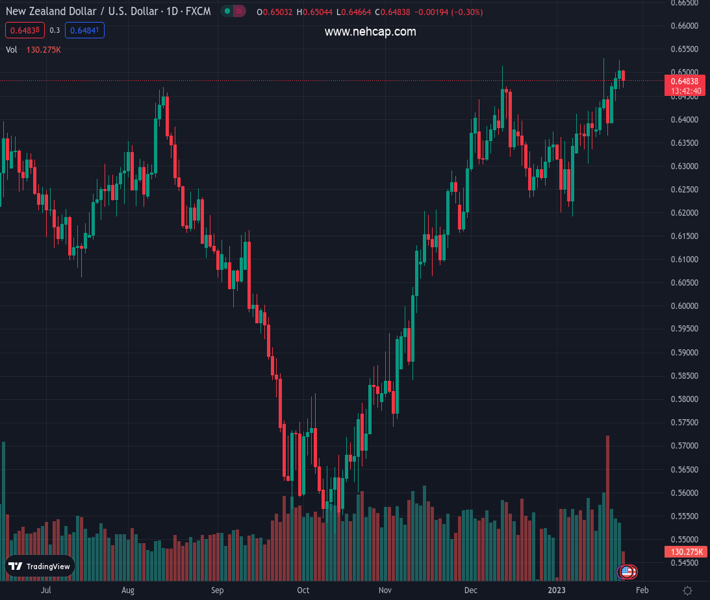
The pair currently trades last at 0.64821.
The previous day high was 0.6522 while the previous day low was 0.6464. The daily 38.2% Fib levels comes at 0.65, expected to provide resistance. Similarly, the daily 61.8% fib level is at 0.6486, expected to provide resistance.
The NZD/USD pair comes under some selling pressure on Wednesday and snaps a three-day winning streak back closer to its highest level since June 2022 touched last week. The pair remains depressed below the 0.6500 psychological mark through the early European session, though lacks follow-through amid subdued US Dollar price action.
The New Zealand Dollar weakens a bit following the release of domestic consumer inflation data, which showed that the headline CPI decelerated to 1.4% during the fourth quarter from the 2.2% previous. Adding to this, the annual inflation rate came in below the Reserve Bank of New Zealand’s (RBNZ) 7.5% forecast and remained stable at 7.2%. The data forces investors to lower the expectations for the cash rate peak in New Zealand to 5%, from 5.5% and prompts some selling around the NZD/USD pair.
Furthermore, worries about a deeper global economic downturn keep a lid on any optimism in the markets and further contributes to driving flows away from the risk-sensitive Kiwi. That said, the underlying bearish sentiment surrounding the greenback helps limit the downside for the NZD/USD pair. In fact, the USD Index, which tracks the greenback’s performance against a basket of currencies, remains depressed near a nine-month low amid expectations for a less aggressive tightening by the Fed.
The markets now seem convinced that the US central bank will soften its hawkish stance and have been pricing in a greater chance of a smaller 25 bps rate hike in February. This might continue to weigh on the buck and supports prospects for the emergence of some dip-buying around the NZD/USD pair. Hence, it will be prudent to wait for strong follow-through selling before confirming that the pair has topped out in the near term and positioning for any deeper corrective pullback.
There isn’t any major market-moving economic data due for release from the US on Wednesday. That said, the broader risk sentiment might influence the USD price dynamics and provide some impetus to the NZD/USD pair. Traders, however, might prefer to wait on the sidelines ahead of this week’s important US macro releases, including the Advance Q4 GDP print and the Core PCE Price Index on Thursday and Friday, respectively.
Technical Levels: Supports and Resistances
NZDUSD currently trading at 0.6485 at the time of writing. Pair opened at 0.6502 and is trading with a change of -0.26 % .
| Overview | Overview.1 | |
|---|---|---|
| 0 | Today last price | 0.6485 |
| 1 | Today Daily Change | -0.0017 |
| 2 | Today Daily Change % | -0.2600 |
| 3 | Today daily open | 0.6502 |
The pair remains strongly bullish on the daily timeframe. It trades above its 20 SMA @ 0.6372, 50 SMA 0.6325, 100 SMA @ 0.6073 and 200 SMA @ 0.6198.
| Trends | Trends.1 | |
|---|---|---|
| 0 | Daily SMA20 | 0.6372 |
| 1 | Daily SMA50 | 0.6325 |
| 2 | Daily SMA100 | 0.6073 |
| 3 | Daily SMA200 | 0.6198 |
The previous day high was 0.6522 while the previous day low was 0.6464. The daily 38.2% Fib levels comes at 0.65, expected to provide resistance. Similarly, the daily 61.8% fib level is at 0.6486, expected to provide resistance.
Note the levels of interest below:
- Pivot support is noted at 0.647, 0.6437, 0.6411
- Pivot resistance is noted at 0.6528, 0.6554, 0.6587
| Levels | Levels.1 |
|---|---|
| Previous Daily High | 0.6522 |
| Previous Daily Low | 0.6464 |
| Previous Weekly High | 0.6531 |
| Previous Weekly Low | 0.6361 |
| Previous Monthly High | 0.6514 |
| Previous Monthly Low | 0.6230 |
| Daily Fibonacci 38.2% | 0.6500 |
| Daily Fibonacci 61.8% | 0.6486 |
| Daily Pivot Point S1 | 0.6470 |
| Daily Pivot Point S2 | 0.6437 |
| Daily Pivot Point S3 | 0.6411 |
| Daily Pivot Point R1 | 0.6528 |
| Daily Pivot Point R2 | 0.6554 |
| Daily Pivot Point R3 | 0.6587 |
[/s2If]
Join Our Telegram Group
")


