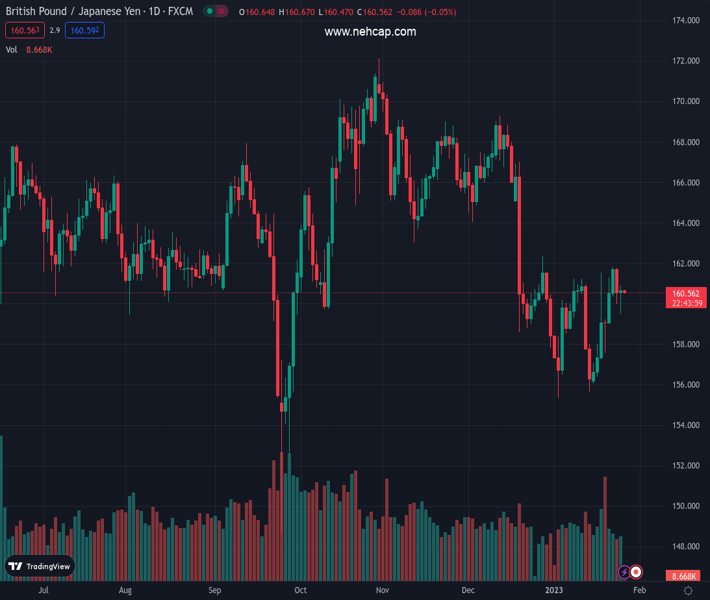
#GBPJPY @ 160.485 Dragonfly doji surfaced as the recovered from weekly lows around the mid-159/160 mark. (Pivot Orderbook analysis)
…
This is a premium post.
[s2If !current_user_can(access_s2member_level4)]Please register for PREMIUM VERSION HERE to read full post below containing analysis. In case of any error or you think you are not able to read the full post below, please email us at support#nehcap.com [lwa][/s2If] [s2If current_user_can(access_s2member_level4)]
- Dragonfly doji surfaced as the GBP/JPY recovered from weekly lows around the mid-159/160 mark.
- GBP/JPY Price Analysis: Neutral to downward biased, but in the short term, it could test the 200-DMA.
The pair currently trades last at 160.485.
The previous day high was 161.85 while the previous day low was 159.99. The daily 38.2% Fib levels comes at 160.7, expected to provide resistance. Similarly, the daily 61.8% fib level is at 161.14, expected to provide resistance.
The GBP/JPY is almost unchanged as the Asian session kicks in, though Wednesday’s session witnessed the cross falling to new weekly lows of 159.50. However, the GBP/JPY pair staged a comeback and formed a dragonfly doji, which suggests bulls are moving in. The GBP/JPY is trading at 160.50 at the time of writing.
From a daily timeframe perspective, the GBP/JPY is still neutral-to-downward biased, with the exchange rate remaining below the trend-setter 200-day Exponential Moving Average (EMA) at 162.14, which is also above the 50-day EMA at 161.74. For the GBP/JPY to continue its downtrend, it would need to crack the 20-day EMA at 160.05, and then, the pair may pose a threat to break below the weekly low of 159.50.
As an alternate scenario, for the GBP/JPY bullish continuation, the pair needs to reclaim the psychological 161.00 figure. Break above will expose the 50-day EMA, followed by the 162.00 mark. Once broken, the bulls could challenge the 200-day EMA at 162.14.
Technical Levels: Supports and Resistances
GBPJPY currently trading at 160.61 at the time of writing. Pair opened at 160.55 and is trading with a change of 0.04 % .
| Overview | Overview.1 | |
|---|---|---|
| 0 | Today last price | 160.61 |
| 1 | Today Daily Change | 0.06 |
| 2 | Today Daily Change % | 0.04 |
| 3 | Today daily open | 160.55 |
The pair is trading above its 20 Daily moving average @ 159.27, below its 50 Daily moving average @ 163.07 , below its 100 Daily moving average @ 163.98 and below its 200 Daily moving average @ 163.46
| Trends | Trends.1 | |
|---|---|---|
| 0 | Daily SMA20 | 159.27 |
| 1 | Daily SMA50 | 163.07 |
| 2 | Daily SMA100 | 163.98 |
| 3 | Daily SMA200 | 163.46 |
The previous day high was 161.85 while the previous day low was 159.99. The daily 38.2% Fib levels comes at 160.7, expected to provide resistance. Similarly, the daily 61.8% fib level is at 161.14, expected to provide resistance.
Note the levels of interest below:
- Pivot support is noted at 159.75, 158.94, 157.89
- Pivot resistance is noted at 161.6, 162.65, 163.46
| Levels | Levels.1 |
|---|---|
| Previous Daily High | 161.85 |
| Previous Daily Low | 159.99 |
| Previous Weekly High | 161.54 |
| Previous Weekly Low | 156.06 |
| Previous Monthly High | 169.28 |
| Previous Monthly Low | 157.84 |
| Daily Fibonacci 38.2% | 160.70 |
| Daily Fibonacci 61.8% | 161.14 |
| Daily Pivot Point S1 | 159.75 |
| Daily Pivot Point S2 | 158.94 |
| Daily Pivot Point S3 | 157.89 |
| Daily Pivot Point R1 | 161.60 |
| Daily Pivot Point R2 | 162.65 |
| Daily Pivot Point R3 | 163.46 |
[/s2If]
Join Our Telegram Group
")


