#AUDUSD @ 0.71159 takes the bids to rise to a fresh high since August 2022., @nehcap view: Limited upside expected (Pivot Orderbook analysis)
…
This is a premium post.
[s2If !current_user_can(access_s2member_level4)]Please register for PREMIUM VERSION HERE to read full post below containing analysis. In case of any error or you think you are not able to read the full post below, please email us at support#nehcap.com [lwa][/s2If] [s2If current_user_can(access_s2member_level4)]
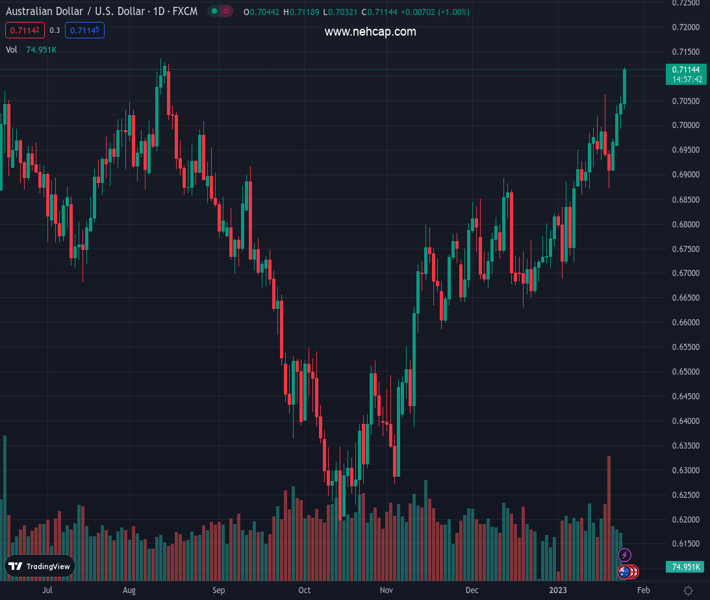
- AUD/USD takes the bids to rise to a fresh high since August 2022.
- A clear upside break of previous resistance from November, bullish MACD signals favor buyers.
- Nearly overbought RSI (14), multiple hurdle since June 2022 challenge immediate upside.
The pair currently trades last at 0.71159.
The previous day high was 0.7058 while the previous day low was 0.6993. The daily 38.2% Fib levels comes at 0.7033, expected to provide support. Similarly, the daily 61.8% fib level is at 0.7018, expected to provide support.
AUD/USD bulls cheer the strong Aussie inflation data as the quote renews the five-month peak near 0.7115 during early Wednesday.
In addition to the upbeat prints of the quarterly Australia Consumer Price Index (CPI) and Reserve Bank of Australia Trimmed Mean CPI, the Aussie pair’s ability to successfully cross an ascending trend line from November 15, around 0.7095 at the latest, also favor the bulls. It’s worth noting that the bullish MACD signals add strength to the upside move.
However, a horizontal area comprising multiple levels marked since June 2022, around 0.7130-40 restricts appears a strong resistance for the AUD/USD pair traders. Adding strength to the stated hurdle is the overbought condition of the RSI (14).
Should the Aussie pair stays comfortably beyond 0.7140, the odds of witnessing the pair’s run-up toward the mid-2022 peak surrounding 0.7285 can’t be ruled out.
Alternatively, intraday sellers could take entries in case the AUD/USD price drops below the resistance-turned-support line near 0.7095.
Even so, the previous weekly high near 0.7065 and the last Thursday’s low near 0.6870 may test the AUD/USD bears.
It should be noted that the 61.8% Fibonacci retracement level of the pair’s June-October 2022 downside and the 200-DMA, respectively near 0.6855 and 0.6815, appear the last defense of the pair buyers as a clear of the same might confirm the bearish trend.
Trend: Limited upside expected
Technical Levels: Supports and Resistances
AUDUSD currently trading at 0.7117 at the time of writing. Pair opened at 0.7042 and is trading with a change of 1.07% % .
| Overview | Overview.1 | |
|---|---|---|
| 0 | Today last price | 0.7117 |
| 1 | Today Daily Change | 0.0075 |
| 2 | Today Daily Change % | 1.07% |
| 3 | Today daily open | 0.7042 |
The pair remains strongly bullish on the daily timeframe. It trades above its 20 SMA @ 0.689, 50 SMA 0.6792, 100 SMA @ 0.6646 and 200 SMA @ 0.6816.
| Trends | Trends.1 | |
|---|---|---|
| 0 | Daily SMA20 | 0.6890 |
| 1 | Daily SMA50 | 0.6792 |
| 2 | Daily SMA100 | 0.6646 |
| 3 | Daily SMA200 | 0.6816 |
The previous day high was 0.7058 while the previous day low was 0.6993. The daily 38.2% Fib levels comes at 0.7033, expected to provide support. Similarly, the daily 61.8% fib level is at 0.7018, expected to provide support.
Note the levels of interest below:
- Pivot support is noted at 0.7005, 0.6967, 0.694
- Pivot resistance is noted at 0.7069, 0.7096, 0.7134
| Levels | Levels.1 |
|---|---|
| Previous Daily High | 0.7058 |
| Previous Daily Low | 0.6993 |
| Previous Weekly High | 0.7064 |
| Previous Weekly Low | 0.6872 |
| Previous Monthly High | 0.6893 |
| Previous Monthly Low | 0.6629 |
| Daily Fibonacci 38.2% | 0.7033 |
| Daily Fibonacci 61.8% | 0.7018 |
| Daily Pivot Point S1 | 0.7005 |
| Daily Pivot Point S2 | 0.6967 |
| Daily Pivot Point S3 | 0.6940 |
| Daily Pivot Point R1 | 0.7069 |
| Daily Pivot Point R2 | 0.7096 |
| Daily Pivot Point R3 | 0.7134 |
[/s2If]
Join Our Telegram Group
")


