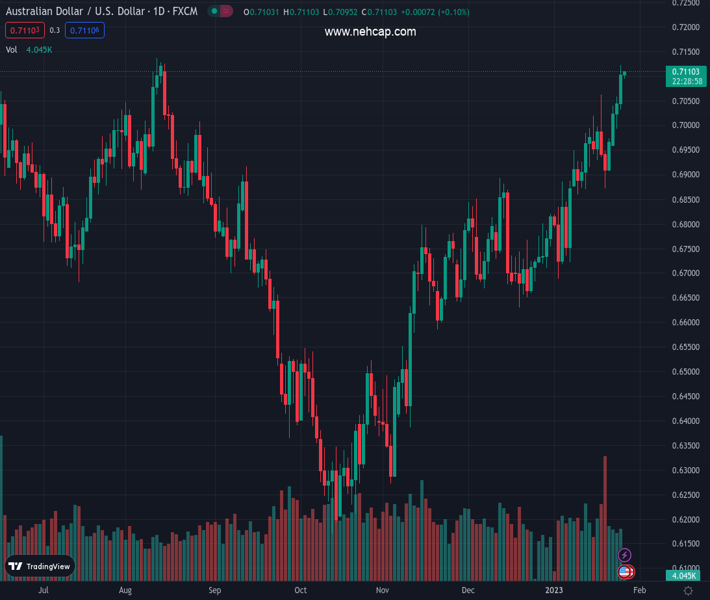
#AUDUSD @ 0.71078 seesaws around five-month high as bulls take a breather after four-day uptrend., @nehcap view: Pullback expected (Pivot Orderbook analysis)
…
This is a premium post.
[s2If !current_user_can(access_s2member_level4)]Please register for PREMIUM VERSION HERE to read full post below containing analysis. In case of any error or you think you are not able to read the full post below, please email us at support#nehcap.com [lwa][/s2If] [s2If current_user_can(access_s2member_level4)]
- AUD/USD seesaws around five-month high as bulls take a breather after four-day uptrend.
- Higher highs on RSI (14) contrast with the lower high on prices to probe the bullish trend.
- Overbought RSI conditions, seven-month-old horizontal hurdle also challenge buyers.
- 61.8% Fibonacci retracement, previous weekly high restrict immediate downside.
The pair currently trades last at 0.71078.
The previous day high was 0.7058 while the previous day low was 0.6993. The daily 38.2% Fib levels comes at 0.7033, expected to provide support. Similarly, the daily 61.8% fib level is at 0.7018, expected to provide support.
AUD/USD pauses the four-day uptrend around the highest level since August 2022 as it makes rounds to 0.7100 during Thursday’s sluggish Asian session. Even so, the Aussie pair braces for the biggest weekly gains since early November.
The quote rose to the multi-month high on crossing the 61.8% Fibonacci retracement level of its April-October 2022 downside. However, the overbought RSI (14) seems to probe the buyers afterward.
Also challenging the upside bias is the hidden bearish RSI divergence, a condition where the price prints lower highs but the indicator prints higher highs.
As a result, the AUD/USD bulls should wait for a confirmation of the latest bullish trend. In doing so, the horizontal area comprising multiple highs marked since June 2022, near 0.7140 will be the key to watch.
Following that, a run-up towards the June 2022 high near 0.7285 can be expected. It’s worth noting that the 0.7200 round figure may act as an intermediate halt during the likely run-up.
Alternatively, pullback moves need to conquer the 61.8% Fibonacci retracement level, also known as the ‘golden ratio’, around 0.7090, to tease the AUD/USD bears.
Even so, the previous weekly high near 0.7065, could act as the additional downside filter before convincing the sellers to attack the 0.7000 psychological magnet.
Trend: Pullback expected
Technical Levels: Supports and Resistances
AUDUSD currently trading at 0.7105 at the time of writing. Pair opened at 0.7042 and is trading with a change of 0.89% % .
| Overview | Overview.1 | |
|---|---|---|
| 0 | Today last price | 0.7105 |
| 1 | Today Daily Change | 0.0063 |
| 2 | Today Daily Change % | 0.89% |
| 3 | Today daily open | 0.7042 |
The pair remains strongly bullish on the daily timeframe. It trades above its 20 SMA @ 0.689, 50 SMA 0.6792, 100 SMA @ 0.6646 and 200 SMA @ 0.6816.
| Trends | Trends.1 | |
|---|---|---|
| 0 | Daily SMA20 | 0.6890 |
| 1 | Daily SMA50 | 0.6792 |
| 2 | Daily SMA100 | 0.6646 |
| 3 | Daily SMA200 | 0.6816 |
The previous day high was 0.7058 while the previous day low was 0.6993. The daily 38.2% Fib levels comes at 0.7033, expected to provide support. Similarly, the daily 61.8% fib level is at 0.7018, expected to provide support.
Note the levels of interest below:
- Pivot support is noted at 0.7005, 0.6967, 0.694
- Pivot resistance is noted at 0.7069, 0.7096, 0.7134
| Levels | Levels.1 |
|---|---|
| Previous Daily High | 0.7058 |
| Previous Daily Low | 0.6993 |
| Previous Weekly High | 0.7064 |
| Previous Weekly Low | 0.6872 |
| Previous Monthly High | 0.6893 |
| Previous Monthly Low | 0.6629 |
| Daily Fibonacci 38.2% | 0.7033 |
| Daily Fibonacci 61.8% | 0.7018 |
| Daily Pivot Point S1 | 0.7005 |
| Daily Pivot Point S2 | 0.6967 |
| Daily Pivot Point S3 | 0.6940 |
| Daily Pivot Point R1 | 0.7069 |
| Daily Pivot Point R2 | 0.7096 |
| Daily Pivot Point R3 | 0.7134 |
[/s2If]
Join Our Telegram Group
")


