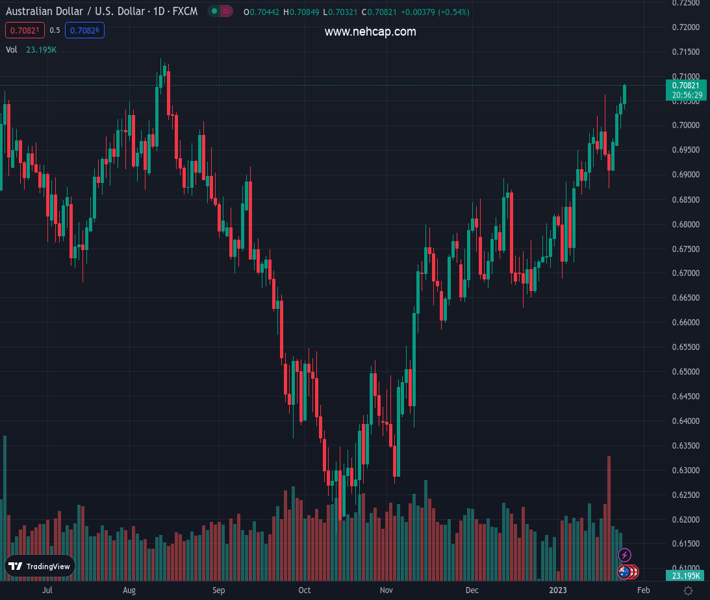
#AUDUSD @ 0.70817 renews multi-day high on strong Aussie inflation report. (Pivot Orderbook analysis)
…
This is a premium post.
[s2If !current_user_can(access_s2member_level4)]Please register for PREMIUM VERSION HERE to read full post below containing analysis. In case of any error or you think you are not able to read the full post below, please email us at support#nehcap.com [lwa][/s2If] [s2If current_user_can(access_s2member_level4)]
- AUD/USD renews multi-day high on strong Aussie inflation report.
- Quarterly Aussie CPI marked 7.8% YoY figures while RBA Trimmed Mean CPI also rose to 6.9% in Q4.
- Mixed sentiment, cautious mood in market also weigh on the risk barometer pair.
- US GDP is the key to watch amid growing support for Fed policy pivot.
The pair currently trades last at 0.70817.
The previous day high was 0.7058 while the previous day low was 0.6993. The daily 38.2% Fib levels comes at 0.7033, expected to provide support. Similarly, the daily 61.8% fib level is at 0.7018, expected to provide support.
AUD/USD jumps to a fresh high since August 15 after strong Australian inflation data please the bulls during early Wednesday. It should be noted, however, that the downbeat sentiment probes the pair due to its risk-barometer status.
That said, Australia’s fourth quarter (Q4) Consumer Price Index (CPI) rose to 7.8% YoY versus 7.5% expected and 7.3% prior while the RBA Trimmed Mean CPI jumped to 6.9% YoY compared to 6.5% market forecasts and 6.1% previous readings. Further, the Monthly CPI rose to 8.4% from 7.3% previous readings and 7.7% market forecasts.
Given the upbeat signals from the inflation data supporting the odds favoring the Reserve Bank of Australia’s (RBA) hawkish move, the AUD/USD prices rallied post-release.
Also read: Breaking: AUD/USD rallies hard on Aussie CPI beat
Other than the Aussie inflation data, the cautious mood in the market ahead of Thursday’s US growth numbers and the next week’s Federal Open Market Committee (FOMC) monetary policy meeting also weigh on the AUD/USD prices. However, mixed signals from the US data and receding hawkish Fed bets seem to put a floor under the Aussie pair.
As per the latest activity data from the US, the outcome has moderated in the last few months but the growth is yet to witness as January’s US S&P Global Composite PMI for January increased to 46.6 from 45.0 prior and the 44.7 consensus, marking the seventh consecutive read below 50. It’s worth observing that preliminary readings of the US S&P Global Manufacturing PMI for January rose past 46.2 market forecast and 46.1 market expectations with 46.8 figure while the Services PMI followed the suit with the 46.6 figure for the said month, versus 44.5 forecast and 44.7 prior.
After the mixed data, Fed fund futures signal the market’s receding hawkish bias. “Fed fund futures see only two more quarter-point rate hikes by the Fed to a peak of around 5% by June, before it starts cutting rates later in the year. The Federal Reserve itself has insisted it still has 75 bps of increases in the pipeline,” said Reuters.
Amid these plays, the S&P 500 Futures print mild losses while tracking Wall Street whereas the US 10-year Treasury yields remain dicey near 3.45%, down for the fourth consecutive week.
Moving on, the first readings of the US fourth-quarter (Q4) Gross Domestic Product (GDP), up for publishing on Thursday, will be crucial to watch for immediate directions. The reason appears logical due to the next week’s Federal Reserve (Fed) meeting, as well as the talks of the US recession. Forecasts suggest the world’s biggest economy eases with 2.8% annualized growth.
Also read: US Gross Domestic Product Preview: Three reasons to expect a US Dollar-boosting outcome
Given the successful break of a one-week-old descending resistance line, around 0.7060 by the press time, the AUD/USD is on the way to the August 2022 peak surrounding 0.7136.
Technical Levels: Supports and Resistances
AUDUSD currently trading at 0.7039 at the time of writing. Pair opened at 0.7042 and is trading with a change of -0.04% % .
| Overview | Overview.1 | |
|---|---|---|
| 0 | Today last price | 0.7039 |
| 1 | Today Daily Change | -0.0003 |
| 2 | Today Daily Change % | -0.04% |
| 3 | Today daily open | 0.7042 |
The pair remains strongly bullish on the daily timeframe. It trades above its 20 SMA @ 0.689, 50 SMA 0.6792, 100 SMA @ 0.6646 and 200 SMA @ 0.6816.
| Trends | Trends.1 | |
|---|---|---|
| 0 | Daily SMA20 | 0.6890 |
| 1 | Daily SMA50 | 0.6792 |
| 2 | Daily SMA100 | 0.6646 |
| 3 | Daily SMA200 | 0.6816 |
The previous day high was 0.7058 while the previous day low was 0.6993. The daily 38.2% Fib levels comes at 0.7033, expected to provide support. Similarly, the daily 61.8% fib level is at 0.7018, expected to provide support.
Note the levels of interest below:
- Pivot support is noted at 0.7005, 0.6967, 0.694
- Pivot resistance is noted at 0.7069, 0.7096, 0.7134
| Levels | Levels.1 |
|---|---|
| Previous Daily High | 0.7058 |
| Previous Daily Low | 0.6993 |
| Previous Weekly High | 0.7064 |
| Previous Weekly Low | 0.6872 |
| Previous Monthly High | 0.6893 |
| Previous Monthly Low | 0.6629 |
| Daily Fibonacci 38.2% | 0.7033 |
| Daily Fibonacci 61.8% | 0.7018 |
| Daily Pivot Point S1 | 0.7005 |
| Daily Pivot Point S2 | 0.6967 |
| Daily Pivot Point S3 | 0.6940 |
| Daily Pivot Point R1 | 0.7069 |
| Daily Pivot Point R2 | 0.7096 |
| Daily Pivot Point R3 | 0.7134 |
[/s2If]
Join Our Telegram Group
")


