A power-pack action is absent as major markets are closed on account of the Lunar New Year holidays. (Pivot Orderbook analysis)
…
This is a premium post.
[s2If !current_user_can(access_s2member_level4)]Please register for PREMIUM VERSION HERE to read full post below containing analysis. In case of any error or you think you are not able to read the full post below, please email us at support#nehcap.com [lwa][/s2If] [s2If current_user_can(access_s2member_level4)]
- A power-pack action is absent as major markets are closed on account of the Lunar New Year holidays.
- The US Dollar Index is struggling to find foot after surrendering the critical support of 101.50.
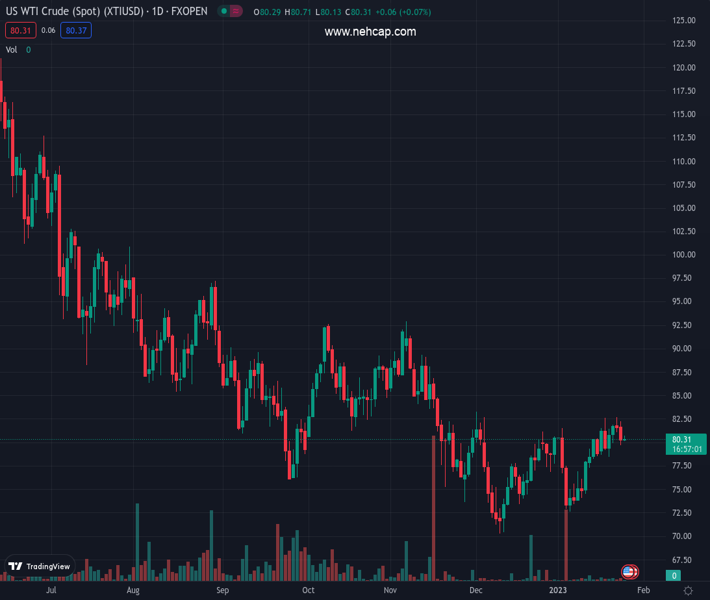
- Oil price has attempted a recovery after dropping to near 101.50 amid escalating supply worries.
The pair currently trades last at 27239.3.
The previous day high was 27315.33 while the previous day low was 27120.72. The daily 38.2% Fib levels comes at 27240.99, expected to provide resistance. Similarly, the daily 61.8% fib level is at 27195.06, expected to provide support.
Markets in the Asian domain are mostly closed to celebrate Lunar New Year. Japanese stocks have extended their rally despite weakness in the S&P500 futures. Equities in the United States are facing pressure as Microsoft missed the estimates and a technical glitch in NYSE on Tuesday has triggered volatility in the S&P500 futures.
At the press time, Japan’s Nikkei225 gained 0.43%, KOSPI surged 1.30%, and Nifty50 drops 0.67% while Chinese and Hong Kong markets are closed on account of the Lunar New Year.
The US Dollar Index (DXY) has sensed rejection from the 101.50 resistance and is expected to resume its downside journey. However, investors should brace for topsy-turvy moves by the USD index ahead of the release of the Gross Domestic Product (GDP) data. On Tuesday, the USD Index displayed sheer volatility after the release of the better-than-projected preliminary US S&P PMI data.
Manufacturing PMI landed at 46.8, higher than the expectations of 46.1 and the former release of 46.2. Also, the Services PMI remained upbeat and scaled higher to 46.6 against the consensus of 44.5 and the prior release of 44.7. The release of the better-than-anticipated US PMI has trimmed recession fears for a while.
Japanese stocks are clearly in an upside trend as Japan’s officials are constantly putting efforts to ramp up growth and wages in the economy. Investors are getting ‘gung ho’ over equities as officials are continuously pumping money to spurt the growth rate. On wage growth, A former Bank of Japan (BoJ) Chief Economist, Kazuo Momma, said in an MNI interview on Wednesday, the BoJ will have to wait until August to gain good insight into whether wage increases are gaining traction.
On the oil front, closed production activities in China due to Lunar New Year celebrations resulted in a sell-off on Tuesday. However, the oil price is showing signs of recovery after dropping to near $80.00 amid growing supply worries. US President Joe Biden is considering refilling the Strategic Petroleum Reserve (SPR) after exploiting it significantly to combat rising oil prices in CY2022.
Technical Levels: Supports and Resistances
XTIUSD currently trading at 27239.3 at the time of writing. Pair opened at 27239.3 and is trading with a change of 0.0 % .
| Overview | Overview.1 | |
|---|---|---|
| 0 | Today last price | 27239.3 |
| 1 | Today Daily Change | 0.0 |
| 2 | Today Daily Change % | 0.0 |
| 3 | Today daily open | 27239.3 |
The pair remains strongly bullish on the daily timeframe. It trades above its 20 SMA @ 26272.18, 50 SMA 27080.2, 100 SMA @ 27196.9 and 200 SMA @ 27209.87.
| Trends | Trends.1 | |
|---|---|---|
| 0 | Daily SMA20 | 26272.18 |
| 1 | Daily SMA50 | 27080.20 |
| 2 | Daily SMA100 | 27196.90 |
| 3 | Daily SMA200 | 27209.87 |
The previous day high was 27315.33 while the previous day low was 27120.72. The daily 38.2% Fib levels comes at 27240.99, expected to provide resistance. Similarly, the daily 61.8% fib level is at 27195.06, expected to provide support.
Note the levels of interest below:
- Pivot support is noted at 27134.9, 27030.51, 26940.29
- Pivot resistance is noted at 27329.51, 27419.73, 27524.12
| Levels | Levels.1 |
|---|---|
| Previous Daily High | 27315.33 |
| Previous Daily Low | 27120.72 |
| Previous Weekly High | 26965.10 |
| Previous Weekly Low | 25812.13 |
| Previous Monthly High | 28325.89 |
| Previous Monthly Low | 25793.22 |
| Daily Fibonacci 38.2% | 27240.99 |
| Daily Fibonacci 61.8% | 27195.06 |
| Daily Pivot Point S1 | 27134.90 |
| Daily Pivot Point S2 | 27030.51 |
| Daily Pivot Point S3 | 26940.29 |
| Daily Pivot Point R1 | 27329.51 |
| Daily Pivot Point R2 | 27419.73 |
| Daily Pivot Point R3 | 27524.12 |
[/s2If]
Join Our Telegram Group
")


