#USDMXN @ 18.8275 with a bullish intraday bias, bearish in the long term. (Pivot Orderbook analysis)
…
This is a premium post.
[s2If !current_user_can(access_s2member_level4)]Please register for PREMIUM VERSION HERE to read full post below containing analysis. In case of any error or you think you are not able to read the full post below, please email us at support#nehcap.com [lwa][/s2If] [s2If current_user_can(access_s2member_level4)]
- USD/MXN with a bullish intraday bias, bearish in the long term.
- Correction from levels above 19.00, finds support at the 18.80 zone.
- US Dollar mixt on Tuesdays gains momentum after US data.
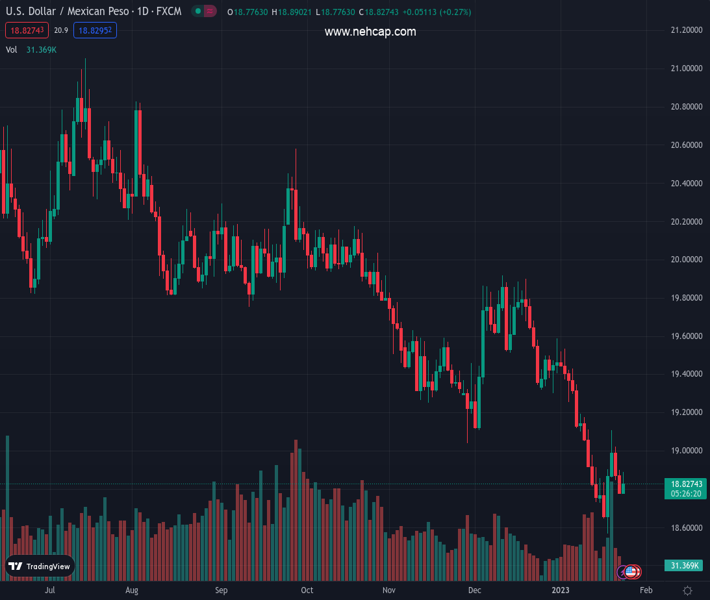
The pair currently trades last at 18.8275.
The previous day high was 18.9198 while the previous day low was 18.7919. The daily 38.2% Fib levels comes at 18.8408, expected to provide resistance. Similarly, the daily 61.8% fib level is at 18.8709, expected to provide resistance.
The USD/MXN is rising on Tuesday, after a two-day correction of the rally from multi-year lows near 18.55 (January 18) to 19.11 (January 19). The decline found support around the 18.80 zone and bounced toward 18.90.
The pair is trading at daily highs at 18.88 following the release of the US S&P Global PMI report that came in above expectations boosting the US Dollar across the board amid higher Treasury bond yields. At the same time, Emerging Market currencies, like the Mexican Peso lost further strength on the back of a deterioration in market sentiment and lower commodity prices.
The Mexican Peso needs to break and hold below 18.80, in order to regain strength. The next support stands at 18.65 followed by the recent bottom near 18.55.
The daily chart shows the main trend is bearish but technical indicators are modestly biased to the upside in the short term, suggesting some consolidation ahead that could be between 18.80 and 19.00, or with a higher limit at 19.11, a horizontal level and the 20-day Simple Moving Average. A break above would strengthen the US Dollar.
Technical Levels: Supports and Resistances
USDMXN currently trading at 18.8846 at the time of writing. Pair opened at 18.8245 and is trading with a change of 0.32 % .
| Overview | Overview.1 | |
|---|---|---|
| 0 | Today last price | 18.8846 |
| 1 | Today Daily Change | 0.0601 |
| 2 | Today Daily Change % | 0.3200 |
| 3 | Today daily open | 18.8245 |
The pair remains strongly bearish on the daily time frame. It trades below the 20 SMA @ 19.1204, 50 SMA 19.36, 100 SMA @ 19.6418 and 200 SMA @ 19.9056.
| Trends | Trends.1 | |
|---|---|---|
| 0 | Daily SMA20 | 19.1204 |
| 1 | Daily SMA50 | 19.3600 |
| 2 | Daily SMA100 | 19.6418 |
| 3 | Daily SMA200 | 19.9056 |
The previous day high was 18.9198 while the previous day low was 18.7919. The daily 38.2% Fib levels comes at 18.8408, expected to provide resistance. Similarly, the daily 61.8% fib level is at 18.8709, expected to provide resistance.
Note the levels of interest below:
- Pivot support is noted at 18.771, 18.7174, 18.643
- Pivot resistance is noted at 18.8989, 18.9734, 19.0269
| Levels | Levels.1 |
|---|---|
| Previous Daily High | 18.9198 |
| Previous Daily Low | 18.7919 |
| Previous Weekly High | 19.1100 |
| Previous Weekly Low | 18.5663 |
| Previous Monthly High | 19.9181 |
| Previous Monthly Low | 19.1084 |
| Daily Fibonacci 38.2% | 18.8408 |
| Daily Fibonacci 61.8% | 18.8709 |
| Daily Pivot Point S1 | 18.7710 |
| Daily Pivot Point S2 | 18.7174 |
| Daily Pivot Point S3 | 18.6430 |
| Daily Pivot Point R1 | 18.8989 |
| Daily Pivot Point R2 | 18.9734 |
| Daily Pivot Point R3 | 19.0269 |
[/s2If]
Join Our Telegram Group
")


