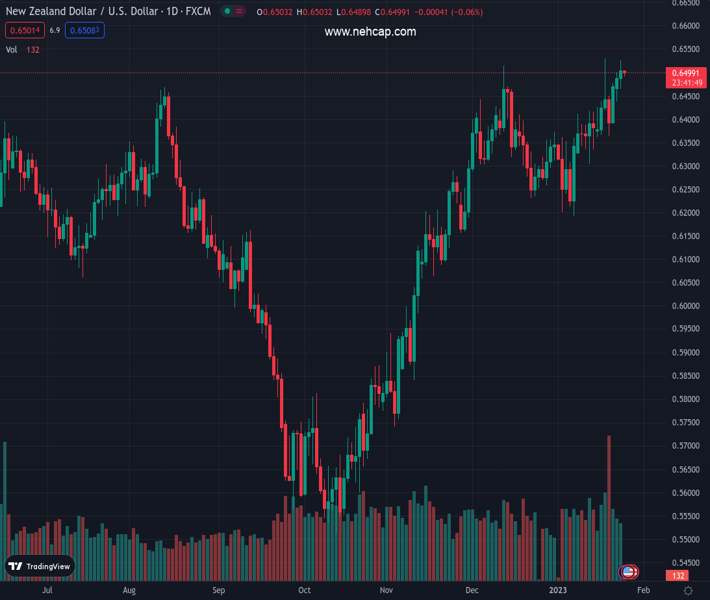
#NZDUSD @ 0.64947 pops 25 bps on upbeat New Zealand Q4 Consumer Price Index. (Pivot Orderbook analysis)
…
This is a premium post.
[s2If !current_user_can(access_s2member_level4)]Please register for PREMIUM VERSION HERE to read full post below containing analysis. In case of any error or you think you are not able to read the full post below, please email us at support#nehcap.com [lwa][/s2If] [s2If current_user_can(access_s2member_level4)]
- NZD/USD pops 25 bps on upbeat New Zealand Q4 Consumer Price Index.
- NZ CPI came in 7.2% YoY, 1.2% QoQ versus 7.1% and 1.3% expected respectively.
- US PMIs failed to impress US Dollar for long as Composite PMI marked seven-month downtrend.
The pair currently trades last at 0.64947.
The previous day high was 0.65 while the previous day low was 0.6437. The daily 38.2% Fib levels comes at 0.6476, expected to provide support. Similarly, the daily 61.8% fib level is at 0.6461, expected to provide support.
NZD/USD begins Wednesday’s trading on a firmer footing on upbeat New Zealand (NZ) inflation data, initially poping up to 0.6525 before retreating to 0.6500 by the press time. Adding strength to the Kiwi pair’s run-up could be the US Dollar’s failure to keep the late Tuesday’s gains amid dovish bias for the Federal Reserve’s next move.
NZ Consumer Price Index (CPI) for the fourth quarter (Q4) rose past 7.1% YoY market forecast to reprint the 7.2% figures while the QoQ data suggests a 1.4% number against 1.3% expected and 2.2% prior. It’s worth noting that the Reserve Bank of New Zealand (RBNZ) anticipated 7.5% yearly inflation in its November meeting.
Also read:
On the other hand, preliminary readings of the US S&P Global Manufacturing PMI for January rose past 46.2 market forecast and 46.1 market expectations with 46.8 figure while the Services PMI followed the suit with the 46.6 figure for the said month, versus 44.5 forecast and 44.7 prior. That said, the S&P Global Composite PMI for January increased to 46.6 from 45.0 prior and the 44.7 consensus, marking the seventh consecutive read below 50.
Following the US data, the US Dollar Index (DXY) managed rise for a brief time before closing in the red. The reason could be linked to the comments from Chief Business Economist at S&P Global Chris Williamson who said, “The US economy has started 2023 on a disappointingly soft note, with business activity contracting sharply again in January.”
That said, receding odds of the Federal Reserve’s (Fed) hawkish play in the next week’s monetary policy meeting, mainly due to the recently downbeat US data seemed to have weighed on the US Treasury bond yields, as well as the US Dollar. It should be noted that the mixed earnings report and sentiment portrayed Wall Street’s mixed close on Tuesday.
Having witnessed the initial reaction to New Zealand inflation data, which is not much alarming, the NZD/USD pair traders may wait for Australia’s CPI and NZ Credit Card Spending data for December for immediate directions.
A six-week-old ascending resistance line near 0.6535 restricts immediate NZD/USD upside amid nearly overbought RSI conditions.
Technical Levels: Supports and Resistances
NZDUSD currently trading at 0.6506 at the time of writing. Pair opened at 0.6487 and is trading with a change of 0.29% % .
| Overview | Overview.1 | |
|---|---|---|
| 0 | Today last price | 0.6506 |
| 1 | Today Daily Change | 0.0019 |
| 2 | Today Daily Change % | 0.29% |
| 3 | Today daily open | 0.6487 |
The pair remains strongly bullish on the daily timeframe. It trades above its 20 SMA @ 0.636, 50 SMA 0.6318, 100 SMA @ 0.6068 and 200 SMA @ 0.6199.
| Trends | Trends.1 | |
|---|---|---|
| 0 | Daily SMA20 | 0.6360 |
| 1 | Daily SMA50 | 0.6318 |
| 2 | Daily SMA100 | 0.6068 |
| 3 | Daily SMA200 | 0.6199 |
The previous day high was 0.65 while the previous day low was 0.6437. The daily 38.2% Fib levels comes at 0.6476, expected to provide support. Similarly, the daily 61.8% fib level is at 0.6461, expected to provide support.
Note the levels of interest below:
- Pivot support is noted at 0.6449, 0.6412, 0.6386
- Pivot resistance is noted at 0.6512, 0.6538, 0.6575
| Levels | Levels.1 |
|---|---|
| Previous Daily High | 0.6500 |
| Previous Daily Low | 0.6437 |
| Previous Weekly High | 0.6531 |
| Previous Weekly Low | 0.6361 |
| Previous Monthly High | 0.6514 |
| Previous Monthly Low | 0.6230 |
| Daily Fibonacci 38.2% | 0.6476 |
| Daily Fibonacci 61.8% | 0.6461 |
| Daily Pivot Point S1 | 0.6449 |
| Daily Pivot Point S2 | 0.6412 |
| Daily Pivot Point S3 | 0.6386 |
| Daily Pivot Point R1 | 0.6512 |
| Daily Pivot Point R2 | 0.6538 |
| Daily Pivot Point R3 | 0.6575 |
[/s2If]
Join Our Telegram Group
")


