#AUDUSD @ 0.70427 prolonged its rally to three straight days, though Wednesday’s Aussie inflation data could rock the boat. (Pivot Orderbook analysis)
…
This is a premium post.
[s2If !current_user_can(access_s2member_level4)]Please register for PREMIUM VERSION HERE to read full post below containing analysis. In case of any error or you think you are not able to read the full post below, please email us at support#nehcap.com [lwa][/s2If] [s2If current_user_can(access_s2member_level4)]
- AUD/USD prolonged its rally to three straight days, though Wednesday’s Aussie inflation data could rock the boat.
- US S&P Global PMIs remained in contractionary territory but came better than expected.
- AUD/USD Price Analysis: To extend its uptrend once it reclaims 0.7070.
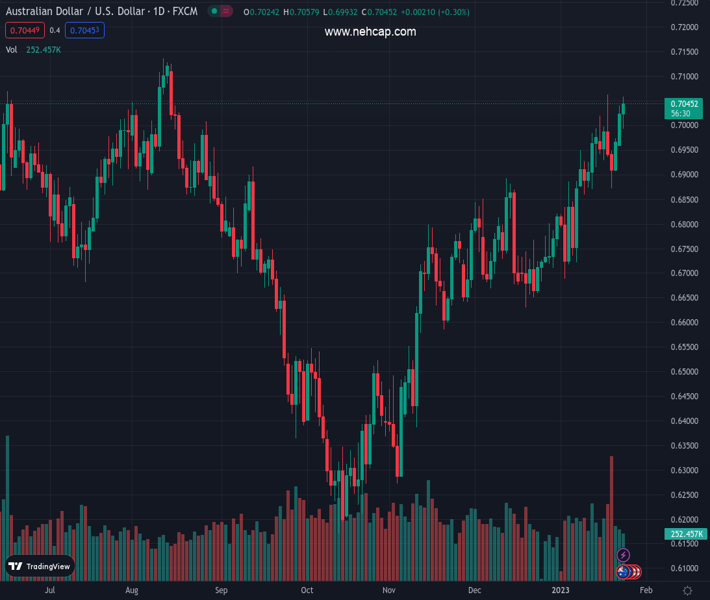
The pair currently trades last at 0.70427.
The previous day high was 0.704 while the previous day low was 0.696. The daily 38.2% Fib levels comes at 0.7009, expected to provide support. Similarly, the daily 61.8% fib level is at 0.699, expected to provide support.
The AUD/USD remains firm late in the New York session, albeit a mixed market mood keeps traders bracing for safe-haven assets. The US Dollar (USD) has recovered some ground late in the session, putting a lid on the AUD/USD steadily advance. At the time of writing, the AUD/USD is trading at 0.7045.
Wall Street remains mixed, as shown by the Dow Jones Industrial, remaining firm, while the S&P 500 and the Nasdaq fluctuate. The US economic calendar featured a business activity report issued by S&P Global. US December’s PMIs improved, with the Services PMI jumping to 46.6 vs. 44.7 expected, while Manufacturing PMI advanced to 46.8 vs. estimates of 46.2.
The S&P Global Composite, which measures both indices, climbed 46.6, higher than the foreseen 45 figure. It should be said that even though business activity continues to deteriorate in the US economy, the downward trend moderated some.
On the Australian side, the docket will feature inflation data. According to Reuters, expectations for the Consumer Price Index (CPI) for Q$ are 1.6%, while on an annual basis, it meanders at 7.5%. Analysts at TD Securities noted that “the trimmed measure that will draw more attention. TD is at 1.6% q/q vs. the RBA, and consensus at 1.5% q/q. Our forecast pegs annually trimmed to hit the highest levels since 1990 at 6.6% vs. the RBA and consensus at 6.5%, above the prior 6.1% y/y print. We expect annual trimmed between 6.1% and 6.5% to lock in a 25bps hike next month.”
The AUD/USD daily chart portrays the pair as upward biased. The pair managed to record gains in three consecutive days, though it had struggled to surpass the January 18 daily high of 0.7063. Nevertheless, the AUD/USD bias remains upward for some reasons: the 20-day Exponential Moving Average (EMA) crossed above the 200-day EMA, while the 50 and 100-day EMAs are closing by. In addition, the Relative Strength Index (RSI) remains in bullish territory. Therefore, the AUD/USD first resistance would be the 0.7063 YTD high, followed by the 0.7100 figure. Break above will expose the August 11 swing high of 0.7136.
Technical Levels: Supports and Resistances
AUDUSD currently trading at 0.7045 at the time of writing. Pair opened at 0.7026 and is trading with a change of 0.27 % .
| Overview | Overview.1 | |
|---|---|---|
| 0 | Today last price | 0.7045 |
| 1 | Today Daily Change | 0.0019 |
| 2 | Today Daily Change % | 0.2700 |
| 3 | Today daily open | 0.7026 |
The pair remains strongly bullish on the daily timeframe. It trades above its 20 SMA @ 0.6875, 50 SMA 0.6786, 100 SMA @ 0.6643 and 200 SMA @ 0.6818.
| Trends | Trends.1 | |
|---|---|---|
| 0 | Daily SMA20 | 0.6875 |
| 1 | Daily SMA50 | 0.6786 |
| 2 | Daily SMA100 | 0.6643 |
| 3 | Daily SMA200 | 0.6818 |
The previous day high was 0.704 while the previous day low was 0.696. The daily 38.2% Fib levels comes at 0.7009, expected to provide support. Similarly, the daily 61.8% fib level is at 0.699, expected to provide support.
Note the levels of interest below:
- Pivot support is noted at 0.6978, 0.6929, 0.6898
- Pivot resistance is noted at 0.7058, 0.7089, 0.7137
| Levels | Levels.1 |
|---|---|
| Previous Daily High | 0.7040 |
| Previous Daily Low | 0.6960 |
| Previous Weekly High | 0.7064 |
| Previous Weekly Low | 0.6872 |
| Previous Monthly High | 0.6893 |
| Previous Monthly Low | 0.6629 |
| Daily Fibonacci 38.2% | 0.7009 |
| Daily Fibonacci 61.8% | 0.6990 |
| Daily Pivot Point S1 | 0.6978 |
| Daily Pivot Point S2 | 0.6929 |
| Daily Pivot Point S3 | 0.6898 |
| Daily Pivot Point R1 | 0.7058 |
| Daily Pivot Point R2 | 0.7089 |
| Daily Pivot Point R3 | 0.7137 |
[/s2If]
Join Our Telegram Group
")


