WTI retreats from intraday high, consolidates gains during two-week uptrend. (Pivot Orderbook analysis)
…
This is a premium post.
[s2If !current_user_can(access_s2member_level4)]Please register for PREMIUM VERSION HERE to read full post below containing analysis. In case of any error or you think you are not able to read the full post below, please email us at support#nehcap.com [lwa][/s2If] [s2If current_user_can(access_s2member_level4)]
- WTI retreats from intraday high, consolidates gains during two-week uptrend.
- Hawkish Fedspeak, downbeat US data underpin economic slowdown fears even as China demand puts a floor under the prices.
- Higher inventory build, recent pause in US Dollar’s downside also challenge Oil buyers.
- Risk catalysts are the key to fresh impulse amid a light calendar.
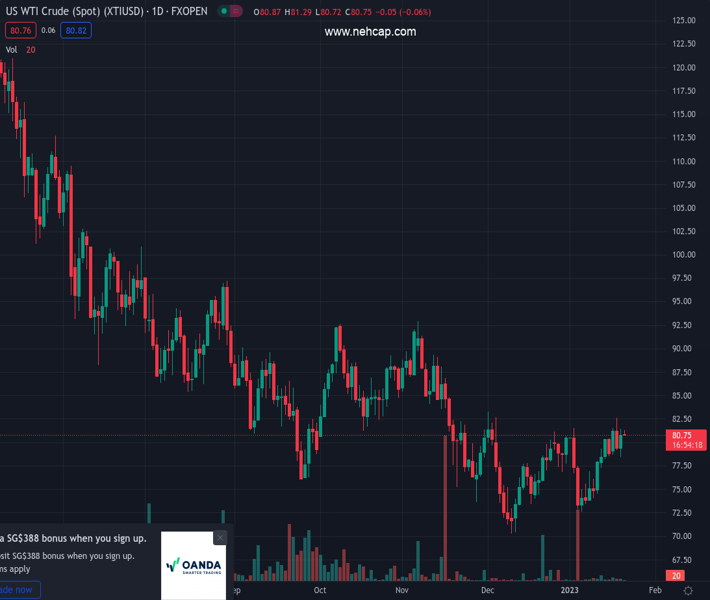
The pair currently trades last at 80.95.
The previous day high was 81.5 while the previous day low was 78.48. The daily 38.2% Fib levels comes at 80.35, expected to provide support. Similarly, the daily 61.8% fib level is at 79.63, expected to provide support.
WTI remains firmer for the second consecutive week even if the intraday buyers retreat during early Friday morning in Europe. That said, the black gold slides to $80.95 while paring the daily gains by the press time.
In doing so, the energy benchmark takes clues from the recent stabilization of the US Dollar, as well as hawkish comments from the Federal Reserve (Fed) officials. On the same line could be the headlines suggesting the US recession and higher crude oil inventory build in the US.
That said, the US Dollar Index (DXY) picks up bids to 102.15 as it consolidates the previous day’s losses, the biggest in over a week, as Fed policymakers favor higher rates during their last public appearances before the 15-day silence period ahead of the February Federal Open Market Committee (FOMC) meeting.
Even so, downbeat US data and looming fears of inflation keep the recession risk on the table and weigh on the Oil prices. On Thursday, the US Unemployment Claims dropped to the lowest levels since late April 2022 and the Philadelphia Fed Manufacturing Survey Index also improved However, US Building and Housing Starts joined the previously release downbeat US Retail Sales and Producer Price Index (PPI) to propel fears of a recession in the world’s largest economy, earlier backed by the softer wage growth and activity data from the US.
Elsewhere, the US Energy Information Administration (EIA) reported an increase in weekly Crude Oil Stocks Change with 8.408M versus -1.75M expected and 18.962M prior, which in turn weighed on the WTI crude oil prices.
Alternatively, the increase in China demand and the People’s Bank of China (PBOC) status quo, as well as the latest tension surrounding Taiwan, seem to put a floor under the Oil prices. Chinese November oil demand climbed to the highest level since February, data from the Joint Organisations Data Initiative showed on Thursday, reported Reuters.
Looking forward, WTI crude oil price may pare some of its recent gains as the US Dollar is gradually justifying hawkish Fed talks. However, a lack of major data/events could challenge the greenback’s upside.
A horizontal area comprising multiple levels marked since October 2022, near $81.30 by the press time, appears a tough nut to crack for Oil buyers. On the contrary, a fortnight-long ascending trend line, near $79.00, as well as a firmer RSI (14), not overbought, keeps the WTI bulls hopeful.
Technical Levels: Supports and Resistances
XTIUSD currently trading at 80.95 at the time of writing. Pair opened at 80.75 and is trading with a change of 0.25% % .
| Overview | Overview.1 | |
|---|---|---|
| 0 | Today last price | 80.95 |
| 1 | Today Daily Change | 0.20 |
| 2 | Today Daily Change % | 0.25% |
| 3 | Today daily open | 80.75 |
The pair is trading above its 20 Daily moving average @ 78.15, above its 50 Daily moving average @ 78.25 , below its 100 Daily moving average @ 81.88 and below its 200 Daily moving average @ 92.09
| Trends | Trends.1 | |
|---|---|---|
| 0 | Daily SMA20 | 78.15 |
| 1 | Daily SMA50 | 78.25 |
| 2 | Daily SMA100 | 81.88 |
| 3 | Daily SMA200 | 92.09 |
The previous day high was 81.5 while the previous day low was 78.48. The daily 38.2% Fib levels comes at 80.35, expected to provide support. Similarly, the daily 61.8% fib level is at 79.63, expected to provide support.
Note the levels of interest below:
- Pivot support is noted at 78.99, 77.23, 75.97
- Pivot resistance is noted at 82.01, 83.26, 85.02
| Levels | Levels.1 |
|---|---|
| Previous Daily High | 81.50 |
| Previous Daily Low | 78.48 |
| Previous Weekly High | 80.25 |
| Previous Weekly Low | 73.89 |
| Previous Monthly High | 83.30 |
| Previous Monthly Low | 70.27 |
| Daily Fibonacci 38.2% | 80.35 |
| Daily Fibonacci 61.8% | 79.63 |
| Daily Pivot Point S1 | 78.99 |
| Daily Pivot Point S2 | 77.23 |
| Daily Pivot Point S3 | 75.97 |
| Daily Pivot Point R1 | 82.01 |
| Daily Pivot Point R2 | 83.26 |
| Daily Pivot Point R3 | 85.02 |
[/s2If]
Join Our Telegram Group
")


