#EURUSD @ 1.08289 retreats from intraday high, pares weekly gains around nine-month high., @nehcap view: Bullish (Pivot Orderbook analysis)
…
This is a premium post.
[s2If !current_user_can(access_s2member_level4)]Please register for PREMIUM VERSION HERE to read full post below containing analysis. In case of any error or you think you are not able to read the full post below, please email us at support#nehcap.com [lwa][/s2If] [s2If current_user_can(access_s2member_level4)]
- EUR/USD retreats from intraday high, pares weekly gains around nine-month high.
- Wednesday’s bullish Doji, sustained trading above 10-DMA keeps buyers hopeful.
- Downside break of 1.0650 could confirm rising wedge bearish chart pattern on D1.
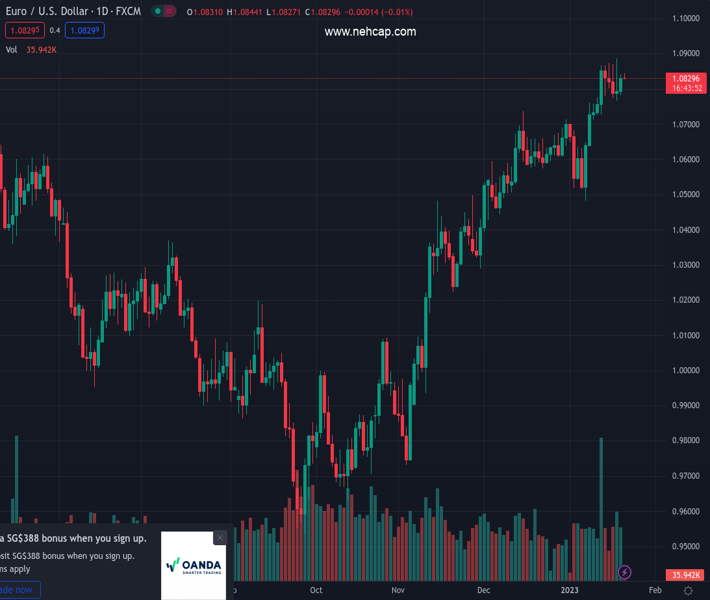
The pair currently trades last at 1.08289.
The previous day high was 1.084 while the previous day low was 1.0782. The daily 38.2% Fib levels comes at 1.0818, expected to provide support. Similarly, the daily 61.8% fib level is at 1.0804, expected to provide support.
EUR/USD grinds lower around intraday bottom as it pares the daily, as well as weekly, gains around the highest levels since April 2022 heading into Friday’s European session.
In doing so, the major currency pair justifies the overbought RSI (14) conditions. However, the Wednesday’s bullish Doji candlestick on the Daily (D1) chart joins the pair’s successful trading above the 10-DMA level of 1.0800 to keep the EUR/USD buyers hopeful.
That said, the quote’s latest pullback appears elusive unless it stays beyond the 1.0800 threshold.
Following that, tops marked during December 15 and 30 of the last month, around 1.0735 and 1.0715 in that order, could challenge the EUR/USD bears.
It’s worth noting, however, that the EUR/USD weakness past 1.0715 will be interesting to watch as the 11-week-old rising wedge highlights the 1.0650 as the key support.
Alternatively, recovery moves may initially aim for the latest peak of 1.0890 ahead of the 1.0900 round figure.
Trend: Bullish
Technical Levels: Supports and Resistances
EURUSD currently trading at 1.083 at the time of writing. Pair opened at 1.0829 and is trading with a change of 0.01 % .
| Overview | Overview.1 | |
|---|---|---|
| 0 | Today last price | 1.0830 |
| 1 | Today Daily Change | 0.0001 |
| 2 | Today Daily Change % | 0.0100 |
| 3 | Today daily open | 1.0829 |
The pair remains strongly bullish on the daily timeframe. It trades above its 20 SMA @ 1.0699, 50 SMA 1.0561, 100 SMA @ 1.0223 and 200 SMA @ 1.031.
| Trends | Trends.1 | |
|---|---|---|
| 0 | Daily SMA20 | 1.0699 |
| 1 | Daily SMA50 | 1.0561 |
| 2 | Daily SMA100 | 1.0223 |
| 3 | Daily SMA200 | 1.0310 |
The previous day high was 1.084 while the previous day low was 1.0782. The daily 38.2% Fib levels comes at 1.0818, expected to provide support. Similarly, the daily 61.8% fib level is at 1.0804, expected to provide support.
Note the levels of interest below:
- Pivot support is noted at 1.0794, 1.0759, 1.0736
- Pivot resistance is noted at 1.0852, 1.0875, 1.091
| Levels | Levels.1 |
|---|---|
| Previous Daily High | 1.0840 |
| Previous Daily Low | 1.0782 |
| Previous Weekly High | 1.0868 |
| Previous Weekly Low | 1.0639 |
| Previous Monthly High | 1.0736 |
| Previous Monthly Low | 1.0393 |
| Daily Fibonacci 38.2% | 1.0818 |
| Daily Fibonacci 61.8% | 1.0804 |
| Daily Pivot Point S1 | 1.0794 |
| Daily Pivot Point S2 | 1.0759 |
| Daily Pivot Point S3 | 1.0736 |
| Daily Pivot Point R1 | 1.0852 |
| Daily Pivot Point R2 | 1.0875 |
| Daily Pivot Point R3 | 1.0910 |
[/s2If]
Join Our Telegram Group
")


