#USDINR @ 81.2650 probes three-day downtrend but bears approach seven-week-old key support line. (Pivot Orderbook analysis)
…
This is a premium post.
[s2If !current_user_can(access_s2member_level4)]Please register for PREMIUM VERSION HERE to read full post below containing analysis. In case of any error or you think you are not able to read the full post below, please email us at support#nehcap.com [lwa][/s2If] [s2If current_user_can(access_s2member_level4)]
- USD/INR probes three-day downtrend but bears approach seven-week-old key support line.
- Hopes of more foreign fund inflow due to moves of Indian private players underpin INR strength.
- Mixed US data weigh US Dollar even as Fed policymakers stay hawkish heading into pre-FOMC blackout.
- Firmer Oil price, RBI’s defensive move could challenge the USD/INR bears.
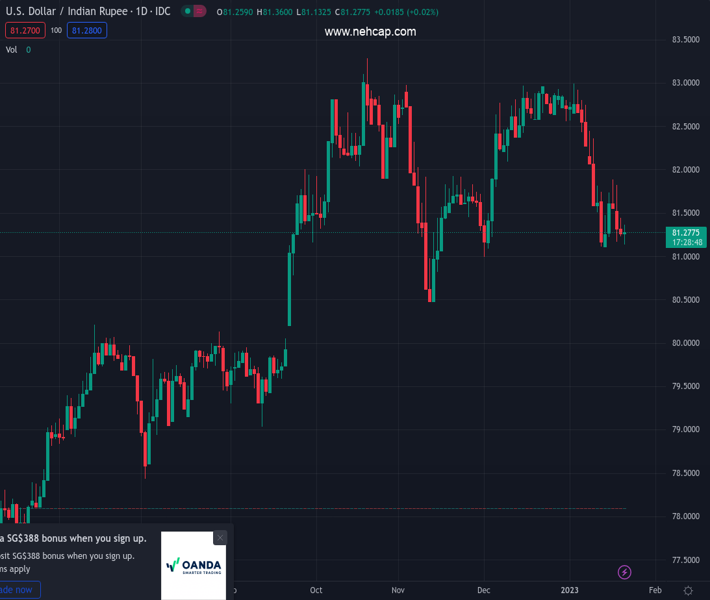
The pair currently trades last at 81.2650.
The previous day high was 81.57 while the previous day low was 81.184. The daily 38.2% Fib levels comes at 81.3315, expected to provide resistance. Similarly, the daily 61.8% fib level is at 81.4226, expected to provide resistance.
USD/INR holds lower ground at the weekly low as bears keep control during early Friday in India, despite recent bounce off the intraday low to 81.25. In doing so, the Indian Rupee (INR) cheers broad US Dollar weakness, as well as hopes of INR demand, amid a sluggish session.
The chatters over heavy inflows due to Adani Enterprise’s $2.5 billion share sale and the merged HDFC’s likelihood of receiving $3.0 billion Foreign Portfolio Investment (FPI) keeps the INR on the front foot. However, upbeat prices of WTI crude oil, up 0.55% intraday near $81.20 by the press time, seem to challenge the pair bears due to India’s reliance on energy imports. On the same line could be the Reserve Bank of India’s (RBI) market meddling to tame the Indian Rupee upside also limit the quote’s losses.
It should be noted that the RBI’s monthly bulletin said on Thursday that a slowdown in growth with possibilities of recession in swathes of the global economy had become the baseline assessment even as inflation might average well above target. The RBI also argued in the bulletin that emerging markets were appearing more resilient now.
Elsewhere, policymakers of the Federal Reserve (Fed), the European Central Bank (ECB) and the Bank of England (BoE) favored the rate hike trajectory despite the recent softening of data. However, the US Dollar failed to cheer the hawkish comments as Treasury bond yields remain sidelined around multi-day low and the US statistics came in mixed on Thursday. That said, Federal Reserve Bank of New York President John Williams and Fed Vice Chair Lael Brainard was the latest ones to back the higher rates at the US central bank as policymakers sneak into the pre-monetary policy mum starting this Saturday.
It should be noted that the People’s Bank of China’s (PBOC) status quo and the Taiwan Defence Ministry’s signal about China’s growing air presence fail to gain major attention.
Against this backdrop, the key US Treasury bond yields remain pressured while the S&P 500 Futures print mild gains. That said, stocks in the Asia-Pacific region trade mixed at the latest.
Moving on, a light calendar pushes USD/INR traders to watch for risk catalysts and central bank comments for fresh impulse.
Although the USD/INR bears keep the reins unless the quote remains below the 100-DMA level of 81.75, an upward-sloping support line from December 01, 2022, around 81.05 by the press time, puts a floor under the price.
Technical Levels: Supports and Resistances
USDINR currently trading at 81.2486 at the time of writing. Pair opened at 81.2335 and is trading with a change of 0.02% % .
| Overview | Overview.1 | |
|---|---|---|
| 0 | Today last price | 81.2486 |
| 1 | Today Daily Change | 0.0151 |
| 2 | Today Daily Change % | 0.02% |
| 3 | Today daily open | 81.2335 |
The pair is trading below its 20 Daily moving average @ 82.165, below its 50 Daily moving average @ 82.0281 , below its 100 Daily moving average @ 81.7194 and above its 200 Daily moving average @ 80.055
| Trends | Trends.1 | |
|---|---|---|
| 0 | Daily SMA20 | 82.1650 |
| 1 | Daily SMA50 | 82.0281 |
| 2 | Daily SMA100 | 81.7194 |
| 3 | Daily SMA200 | 80.0550 |
The previous day high was 81.57 while the previous day low was 81.184. The daily 38.2% Fib levels comes at 81.3315, expected to provide resistance. Similarly, the daily 61.8% fib level is at 81.4226, expected to provide resistance.
Note the levels of interest below:
- Pivot support is noted at 81.0884, 80.9432, 80.7024
- Pivot resistance is noted at 81.4744, 81.7152, 81.8604
| Levels | Levels.1 |
|---|---|
| Previous Daily High | 81.5700 |
| Previous Daily Low | 81.1840 |
| Previous Weekly High | 82.5294 |
| Previous Weekly Low | 81.0769 |
| Previous Monthly High | 84.2500 |
| Previous Monthly Low | 80.9855 |
| Daily Fibonacci 38.2% | 81.3315 |
| Daily Fibonacci 61.8% | 81.4226 |
| Daily Pivot Point S1 | 81.0884 |
| Daily Pivot Point S2 | 80.9432 |
| Daily Pivot Point S3 | 80.7024 |
| Daily Pivot Point R1 | 81.4744 |
| Daily Pivot Point R2 | 81.7152 |
| Daily Pivot Point R3 | 81.8604 |
[/s2If]
Join Our Telegram Group
")


