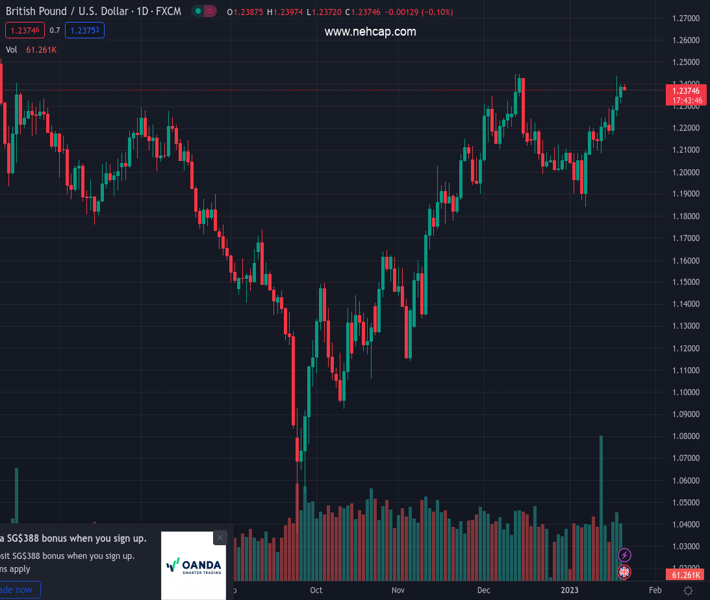
#GBPUSD @ 1.23740 The Cable is displaying a balanced auction ahead of the UK Retail Sales data. (Pivot Orderbook analysis)
…
This is a premium post.
[s2If !current_user_can(access_s2member_level4)]Please register for PREMIUM VERSION HERE to read full post below containing analysis. In case of any error or you think you are not able to read the full post below, please email us at support#nehcap.com [lwa][/s2If] [s2If current_user_can(access_s2member_level4)]
- The Cable is displaying a balanced auction ahead of the UK Retail Sales data.
- Pound Sterling has resumed its upside journey after testing the breakout zone of the Rising Channel pattern.
- A 60.00-80.00 range oscillation by the RSI (14) indicates that the upside momentum is active.
The pair currently trades last at 1.23740.
The previous day high was 1.2397 while the previous day low was 1.2313. The daily 38.2% Fib levels comes at 1.2365, expected to provide support. Similarly, the daily 61.8% fib level is at 1.2345, expected to provide support.
The GBP/USD pair is displaying back-and-forth moves below the round-level resistance of 1.2400 in the Asian session. The Cable has turned sideways as investors are awaiting the release of the United Kingdom Retail Sales data for fresh impetus. An improvement is expected from the economic data that their former figures and the reason behind improvement could be rising wages due to the tight labor market.
The US Dollar Index (DXY) is attempting to come out of the woods, has traded in a narrow range in Asia, and is trying to break north. Meanwhile, the S&P500 futures have not surrendered their early gains yet, portraying minor optimism in the overall bearish market mood.
GBP/USD resumed its upside journey after testing the strength of the breakout of the Rising Channel chart pattern above 1.2300. It seems fine considering the asset in a bullish trajectory as the chart formation seems solid for the Pound Sterling.
The asset recovered firmly after testing the 50-period Exponential Moving Average (EMA) at 1.2317. The 20-EMA at 1.2374 is sloping north, which indicates that the short-term trend is bullish.
Meanwhile, the Relative Strength Index (RSI) (14) is oscillating in a bullish range of 60.00-80.00, which indicates that the bullish momentum has already been triggered.
Should the Cable break above the round-level resistance of 1.2400 decisively, Pound Sterling bulls will drive the asset towards the psychological resistance of 1.2500 and June 7 high around 1.2600.
The Cable will display a sheer downside if it drops below Monday’s low at 1.2171 as it will drag the major toward January 11 low at 1.2100 followed by the psychological support at 1.2000.
Technical Levels: Supports and Resistances
GBPUSD currently trading at 1.2381 at the time of writing. Pair opened at 1.2387 and is trading with a change of -0.05 % .
| Overview | Overview.1 | |
|---|---|---|
| 0 | Today last price | 1.2381 |
| 1 | Today Daily Change | -0.0006 |
| 2 | Today Daily Change % | -0.0500 |
| 3 | Today daily open | 1.2387 |
The pair remains strongly bullish on the daily timeframe. It trades above its 20 SMA @ 1.2125, 50 SMA 1.2099, 100 SMA @ 1.1715 and 200 SMA @ 1.1982.
| Trends | Trends.1 | |
|---|---|---|
| 0 | Daily SMA20 | 1.2125 |
| 1 | Daily SMA50 | 1.2099 |
| 2 | Daily SMA100 | 1.1715 |
| 3 | Daily SMA200 | 1.1982 |
The previous day high was 1.2397 while the previous day low was 1.2313. The daily 38.2% Fib levels comes at 1.2365, expected to provide support. Similarly, the daily 61.8% fib level is at 1.2345, expected to provide support.
Note the levels of interest below:
- Pivot support is noted at 1.2334, 1.2281, 1.225
- Pivot resistance is noted at 1.2419, 1.245, 1.2503
| Levels | Levels.1 |
|---|---|
| Previous Daily High | 1.2397 |
| Previous Daily Low | 1.2313 |
| Previous Weekly High | 1.2249 |
| Previous Weekly Low | 1.2086 |
| Previous Monthly High | 1.2447 |
| Previous Monthly Low | 1.1992 |
| Daily Fibonacci 38.2% | 1.2365 |
| Daily Fibonacci 61.8% | 1.2345 |
| Daily Pivot Point S1 | 1.2334 |
| Daily Pivot Point S2 | 1.2281 |
| Daily Pivot Point S3 | 1.2250 |
| Daily Pivot Point R1 | 1.2419 |
| Daily Pivot Point R2 | 1.2450 |
| Daily Pivot Point R3 | 1.2503 |
[/s2If]
Join Our Telegram Group
")


