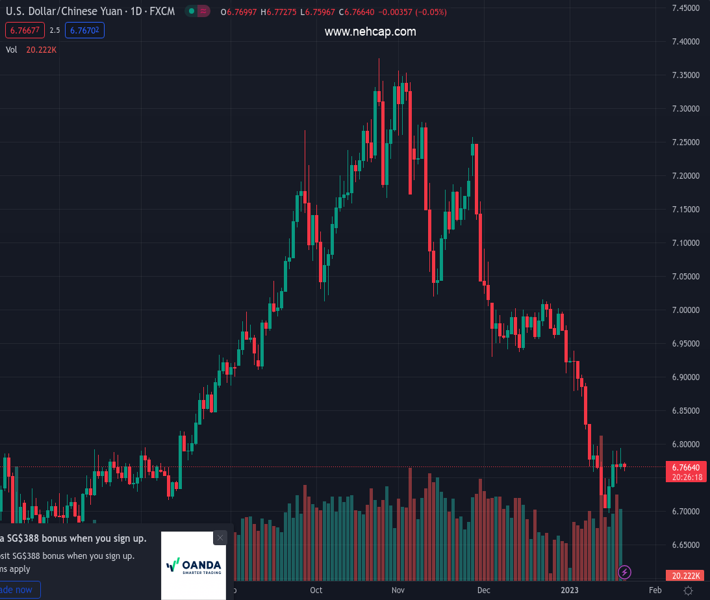
#USDCNH @ 6.76242 consolidates weekly gains with mild daily losses. (Pivot Orderbook analysis)
…
This is a premium post.
[s2If !current_user_can(access_s2member_level4)]Please register for PREMIUM VERSION HERE to read full post below containing analysis. In case of any error or you think you are not able to read the full post below, please email us at support#nehcap.com [lwa][/s2If] [s2If current_user_can(access_s2member_level4)]
- USD/CNH consolidates weekly gains with mild daily losses.
- PBOC keeps one-year, five-year Loan Prime Rates (LPRs) unchanged.
- US Dollar’s inability to cheer hawkish Fedspeak weigh on prices amid cautious optimism.
The pair currently trades last at 6.76242.
The previous day high was 6.7946 while the previous day low was 6.7624. The daily 38.2% Fib levels comes at 6.7823, expected to provide resistance. Similarly, the daily 61.8% fib level is at 6.7748, expected to provide resistance.
USD/CNH remains pressured around 6.7700, printing the first daily loss in a week, as trades react to the People’s Bank of China’s (PBOC) status quo during early Friday. In doing so, the offshore Chinese Yuan (CNH) pair cheers the broad US Dollar weakness.
That said, the PBOC kept the one-year and five-year LPRs unchanged at 3.65% and 4.30%, as expected, during its latest monetary policy meeting. With this, the Chinese central bank keeps the rates unchanged for the fifth consecutive month and defends its easy-money policy.
Even so, the CNH cheers the broadly downbeat US Dollar as fears of economic slowdown loom over the US, especially after the recently softer data. It should be observed that the US Unemployment Claims dropped to the lowest levels since late April 2022, to 190K for the week ended on January 13 versus 214K expected and 205K prior. Further, the Philadelphia Fed Manufacturing Survey Index improved to -8.9 for January compared to -11.0 market forecasts and -13.7 previous readings. However, US Building Permits eased in December to 1.33M MoM versus 1.37M consensus and 1.351M prior while the Housing Starts also dropped to 1.382M during the stated month from 1.401M in November, versus 1.359M expected. Previously, the downbeat US Retail Sales and Producer Price Index (PPI) raised fears of a recession in the world’s largest economy after the softer wage growth and activity data flashed earlier.
Elsewhere, hawkish Federal Reserve (Fed) comments and fears of fresh geopolitical tensions emanating from China seem to challenge the USD/CNH bears. That said, Federal Reserve Bank of New York President John Williams recently said that the US central bank has more rate hikes ahead and sees signs inflationary pressures might be starting to cool off from torrid levels. Late Thursday, Fed Vice Chair Lael Brainard said that it will take time and resolve to get high inflation down to the fed’s 2% target. The policymaker also added, “The policy will need to be sufficiently restrictive for some time.” On the same line, Boston Fed President Collins signaled that the baseline remains that the effective fed funds rate should settle slightly above 5.0%, implying three more 25bp rate rises.
Additionally, Taiwan Defence Ministry mentioned that in the past 24 hours, 12 Chinese air force planes entered Taiwan’s air defense zone
Amid these plays, stock futures are mildly bid and the US Treasury yields defend the previous day’s rebound from a multi-day low. However, the US Dollar Index (DXY) stays pressured.
Looking forward, a light calendar and a lack of major events keep the last round of Fed talks in the spotlight ahead of the pre-FOMC blackout starting from Saturday.
Despite the latest retreat, the USD/CNH pair defends the previous day’s upside break of the 10-DMA, around 6.7600 by the press time, amid a looming bull cross on the MACD and nearly oversold RSI (14). As a result, the buyers seem capable to aim for the 6.8000 psychological magnet.
Technical Levels: Supports and Resistances
USDCNH currently trading at 6.771 at the time of writing. Pair opened at 6.775 and is trading with a change of -0.06% % .
| Overview | Overview.1 | |
|---|---|---|
| 0 | Today last price | 6.771 |
| 1 | Today Daily Change | -0.0040 |
| 2 | Today Daily Change % | -0.06% |
| 3 | Today daily open | 6.775 |
The pair remains strongly bearish on the daily time frame. It trades below the 20 SMA @ 6.8587, 50 SMA 6.9748, 100 SMA @ 7.0566 and 200 SMA @ 6.8881.
| Trends | Trends.1 | |
|---|---|---|
| 0 | Daily SMA20 | 6.8587 |
| 1 | Daily SMA50 | 6.9748 |
| 2 | Daily SMA100 | 7.0566 |
| 3 | Daily SMA200 | 6.8881 |
The previous day high was 6.7946 while the previous day low was 6.7624. The daily 38.2% Fib levels comes at 6.7823, expected to provide resistance. Similarly, the daily 61.8% fib level is at 6.7748, expected to provide resistance.
Note the levels of interest below:
- Pivot support is noted at 6.7601, 6.7452, 6.7279
- Pivot resistance is noted at 6.7923, 6.8096, 6.8245
| Levels | Levels.1 |
|---|---|
| Previous Daily High | 6.7946 |
| Previous Daily Low | 6.7624 |
| Previous Weekly High | 6.8314 |
| Previous Weekly Low | 6.7056 |
| Previous Monthly High | 7.0914 |
| Previous Monthly Low | 6.9050 |
| Daily Fibonacci 38.2% | 6.7823 |
| Daily Fibonacci 61.8% | 6.7748 |
| Daily Pivot Point S1 | 6.7601 |
| Daily Pivot Point S2 | 6.7452 |
| Daily Pivot Point S3 | 6.7279 |
| Daily Pivot Point R1 | 6.7923 |
| Daily Pivot Point R2 | 6.8096 |
| Daily Pivot Point R3 | 6.8245 |
[/s2If]
Join Our Telegram Group
")


