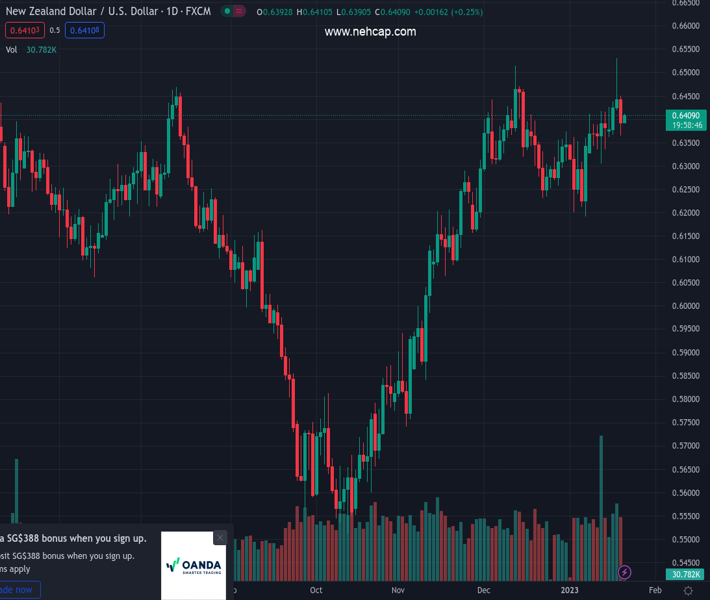
#NZDUSD @ 0.64083 grinds near intraday high as key resistance confluence challenges buyers., @nehcap view: Pullback expected (Pivot Orderbook analysis)
…
This is a premium post.
[s2If !current_user_can(access_s2member_level4)]Please register for PREMIUM VERSION HERE to read full post below containing analysis. In case of any error or you think you are not able to read the full post below, please email us at support#nehcap.com [lwa][/s2If] [s2If current_user_can(access_s2member_level4)]
- NZD/USD grinds near intraday high as key resistance confluence challenges buyers.
- Convergence of 50-EMA, 100-EMA and one-week-old previous support line probe Kiwi bulls.
- Sellers need validation from 0.6315 to retake control.
The pair currently trades last at 0.64083.
The previous day high was 0.645 while the previous day low was 0.6365. The daily 38.2% Fib levels comes at 0.6397, expected to provide support. Similarly, the daily 61.8% fib level is at 0.6418, expected to provide resistance.
NZD/USD buyers attack the short-term key hurdle above 0.6400 while bracing for the second weekly gain on early Friday. In doing so, the Kiwi pair also consolidates the previous day’s losses, the biggest on daily play in two weeks, as the People’s Bank of China (PBOC) defends its easy-money policy with the latest status quo.
PBOC kept the one-year and five-year LPRs unchanged at 3.65% and 4.30%, as expected, during its latest monetary policy meeting. With this, the Chinese central bank keeps the rates unchanged for the fifth consecutive month and defends its easy-money policy.
Even if the PBOC-led risk-on mood joins the softer US Dollar to propel the NZD/USD price, the 100-bar Exponential Moving Average (EMA) joins the 50-EMA and the weekly support-turned-resistance to challenge the bulls around 0.6415.
It should be noted that the bullish MACD signals keep buyers hopeful of crossing the stated hurdle.
Following that, the 0.6460 and the 0.6500 round figure may please the Kiwi bulls before directing them to the monthly peak of 0.6531.
Alternatively, the previous day’s low of 0.6365 restricts the immediate downside of the quote, a break of which will highlight the 61.8% Fibonacci retracement level of the NZD/USD pair’s January 06-18 upside, near 0.6315.
In a case where NZD/USD remains weaker past 0.6315, the odds of witnessing a slump toward the monthly low of 0.6190 can’t be ruled out.
Trend: Pullback expected
Technical Levels: Supports and Resistances
NZDUSD currently trading at 0.6407 at the time of writing. Pair opened at 0.6398 and is trading with a change of 0.14% % .
| Overview | Overview.1 | |
|---|---|---|
| 0 | Today last price | 0.6407 |
| 1 | Today Daily Change | 0.0009 |
| 2 | Today Daily Change % | 0.14% |
| 3 | Today daily open | 0.6398 |
The pair remains strongly bullish on the daily timeframe. It trades above its 20 SMA @ 0.6342, 50 SMA 0.6304, 100 SMA @ 0.6061 and 200 SMA @ 0.6202.
| Trends | Trends.1 | |
|---|---|---|
| 0 | Daily SMA20 | 0.6342 |
| 1 | Daily SMA50 | 0.6304 |
| 2 | Daily SMA100 | 0.6061 |
| 3 | Daily SMA200 | 0.6202 |
The previous day high was 0.645 while the previous day low was 0.6365. The daily 38.2% Fib levels comes at 0.6397, expected to provide support. Similarly, the daily 61.8% fib level is at 0.6418, expected to provide resistance.
Note the levels of interest below:
- Pivot support is noted at 0.6359, 0.6319, 0.6274
- Pivot resistance is noted at 0.6444, 0.6489, 0.6529
| Levels | Levels.1 |
|---|---|
| Previous Daily High | 0.6450 |
| Previous Daily Low | 0.6365 |
| Previous Weekly High | 0.6418 |
| Previous Weekly Low | 0.6314 |
| Previous Monthly High | 0.6514 |
| Previous Monthly Low | 0.6230 |
| Daily Fibonacci 38.2% | 0.6397 |
| Daily Fibonacci 61.8% | 0.6418 |
| Daily Pivot Point S1 | 0.6359 |
| Daily Pivot Point S2 | 0.6319 |
| Daily Pivot Point S3 | 0.6274 |
| Daily Pivot Point R1 | 0.6444 |
| Daily Pivot Point R2 | 0.6489 |
| Daily Pivot Point R3 | 0.6529 |
[/s2If]
Join Our Telegram Group
")


