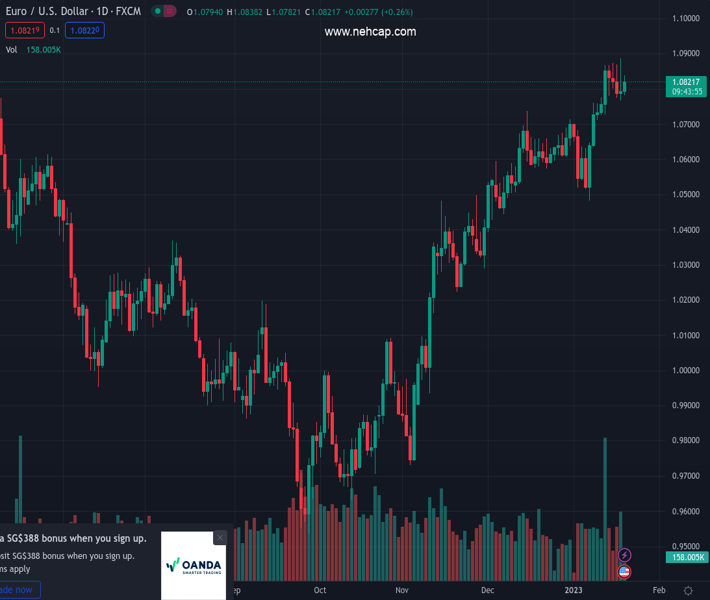
#EURUSD @ 1.08224 reclaims the 1.0800 area and above after dropping to 1.0770. (Pivot Orderbook analysis)
…
This is a premium post.
[s2If !current_user_can(access_s2member_level4)]Please register for PREMIUM VERSION HERE to read full post below containing analysis. In case of any error or you think you are not able to read the full post below, please email us at support#nehcap.com [lwa][/s2If] [s2If current_user_can(access_s2member_level4)]
- EUR/USD reclaims the 1.0800 area and above after dropping to 1.0770.
- Immediately to the upside now emerges the 2022 peak at 1.0887.
The pair currently trades last at 1.08224.
The previous day high was 1.0888 while the previous day low was 1.0766. The daily 38.2% Fib levels comes at 1.0813, expected to provide support. Similarly, the daily 61.8% fib level is at 1.0841, expected to provide resistance.
EUR/USD adds to Wednesday’s uptick and manages to retake the area above the key 1.0800 barrier on Thursday.
It seems the pair is moving within a range bound theme ahead of the potential resumption of the uptrend. Against that, the immediate resistance level comes at the so far YTD high at 1.0887 (January 18). Once cleared, it could lead up to a probable visit to the round level at 1.0900 in the relatively short-term horizon.
Furthermore, while above the short-term support line near 1.0610, extra gains should remain in store.
In the longer run, the constructive view remains unchanged while above the 200-day SMA at 1.0307.
Technical Levels: Supports and Resistances
EURUSD currently trading at 1.0822 at the time of writing. Pair opened at 1.0789 and is trading with a change of 0.31 % .
| Overview | Overview.1 | |
|---|---|---|
| 0 | Today last price | 1.0822 |
| 1 | Today Daily Change | 56.0000 |
| 2 | Today Daily Change % | 0.3100 |
| 3 | Today daily open | 1.0789 |
The pair remains strongly bullish on the daily timeframe. It trades above its 20 SMA @ 1.0687, 50 SMA 1.0548, 100 SMA @ 1.0214 and 200 SMA @ 1.031.
| Trends | Trends.1 | |
|---|---|---|
| 0 | Daily SMA20 | 1.0687 |
| 1 | Daily SMA50 | 1.0548 |
| 2 | Daily SMA100 | 1.0214 |
| 3 | Daily SMA200 | 1.0310 |
The previous day high was 1.0888 while the previous day low was 1.0766. The daily 38.2% Fib levels comes at 1.0813, expected to provide support. Similarly, the daily 61.8% fib level is at 1.0841, expected to provide resistance.
Note the levels of interest below:
- Pivot support is noted at 1.0741, 1.0693, 1.062
- Pivot resistance is noted at 1.0862, 1.0936, 1.0984
| Levels | Levels.1 |
|---|---|
| Previous Daily High | 1.0888 |
| Previous Daily Low | 1.0766 |
| Previous Weekly High | 1.0868 |
| Previous Weekly Low | 1.0639 |
| Previous Monthly High | 1.0736 |
| Previous Monthly Low | 1.0393 |
| Daily Fibonacci 38.2% | 1.0813 |
| Daily Fibonacci 61.8% | 1.0841 |
| Daily Pivot Point S1 | 1.0741 |
| Daily Pivot Point S2 | 1.0693 |
| Daily Pivot Point S3 | 1.0620 |
| Daily Pivot Point R1 | 1.0862 |
| Daily Pivot Point R2 | 1.0936 |
| Daily Pivot Point R3 | 1.0984 |
[/s2If]
Join Our Telegram Group
")


