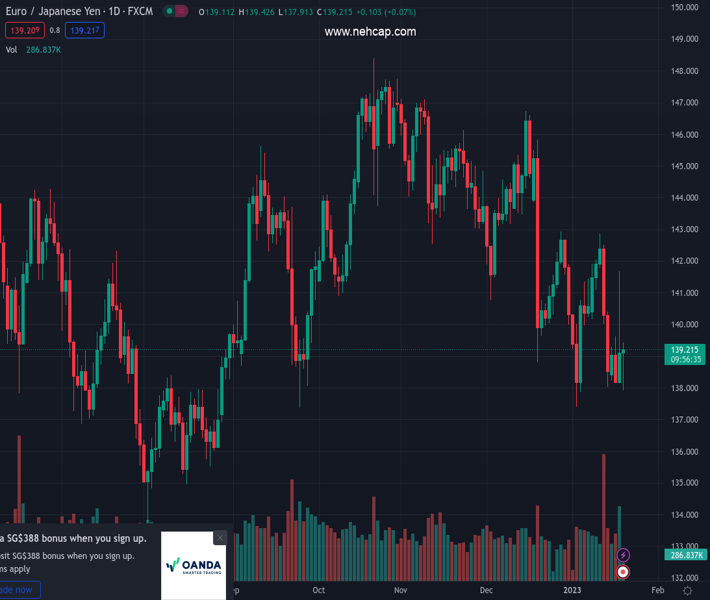
#EURJPY @ 139.164 trades in a volatile fashion and bounces off the 138.00 area. (Pivot Orderbook analysis)
…
This is a premium post.
[s2If !current_user_can(access_s2member_level4)]Please register for PREMIUM VERSION HERE to read full post below containing analysis. In case of any error or you think you are not able to read the full post below, please email us at support#nehcap.com [lwa][/s2If] [s2If current_user_can(access_s2member_level4)]
- EUR/JPY trades in a volatile fashion and bounces off the 138.00 area.
- The loss of the latter could prompt losses to accelerate in the near term.
The pair currently trades last at 139.164.
The previous day high was 141.69 while the previous day low was 138.18. The daily 38.2% Fib levels comes at 140.35, expected to provide resistance. Similarly, the daily 61.8% fib level is at 139.52, expected to provide resistance.
EUR/JPY manages to stage quite a firm rebound after briefly trespassing the key contention in the 138.00 region on Thursday.
The cross needs to clear the 200-day SMA in a convincing note, ideally in the very near term, to shift the outlook to a more constructive one. Extra gains from here should revisit the key resistance area near 143.00 (high December 28, January 11).
The breakdown of the 138.00 support zone could spark further weakness in the cross to, initially, the so far YTD low at 137.38 (January 3).
Technical Levels: Supports and Resistances
EURJPY currently trading at 139.18 at the time of writing. Pair opened at 139.04 and is trading with a change of 0.1 % .
| Overview | Overview.1 | |
|---|---|---|
| 0 | Today last price | 139.18 |
| 1 | Today Daily Change | 151.00 |
| 2 | Today Daily Change % | 0.10 |
| 3 | Today daily open | 139.04 |
The pair remains strongly bearish on the daily time frame. It trades below the 20 SMA @ 140.51, 50 SMA 142.6, 100 SMA @ 143.13 and 200 SMA @ 140.74.
| Trends | Trends.1 | |
|---|---|---|
| 0 | Daily SMA20 | 140.51 |
| 1 | Daily SMA50 | 142.60 |
| 2 | Daily SMA100 | 143.13 |
| 3 | Daily SMA200 | 140.74 |
The previous day high was 141.69 while the previous day low was 138.18. The daily 38.2% Fib levels comes at 140.35, expected to provide resistance. Similarly, the daily 61.8% fib level is at 139.52, expected to provide resistance.
Note the levels of interest below:
- Pivot support is noted at 137.58, 136.12, 134.07
- Pivot resistance is noted at 141.1, 143.15, 144.61
| Levels | Levels.1 |
|---|---|
| Previous Daily High | 141.69 |
| Previous Daily Low | 138.18 |
| Previous Weekly High | 142.86 |
| Previous Weekly Low | 138.01 |
| Previous Monthly High | 146.73 |
| Previous Monthly Low | 138.80 |
| Daily Fibonacci 38.2% | 140.35 |
| Daily Fibonacci 61.8% | 139.52 |
| Daily Pivot Point S1 | 137.58 |
| Daily Pivot Point S2 | 136.12 |
| Daily Pivot Point S3 | 134.07 |
| Daily Pivot Point R1 | 141.10 |
| Daily Pivot Point R2 | 143.15 |
| Daily Pivot Point R3 | 144.61 |
[/s2If]
Join Our Telegram Group
")


