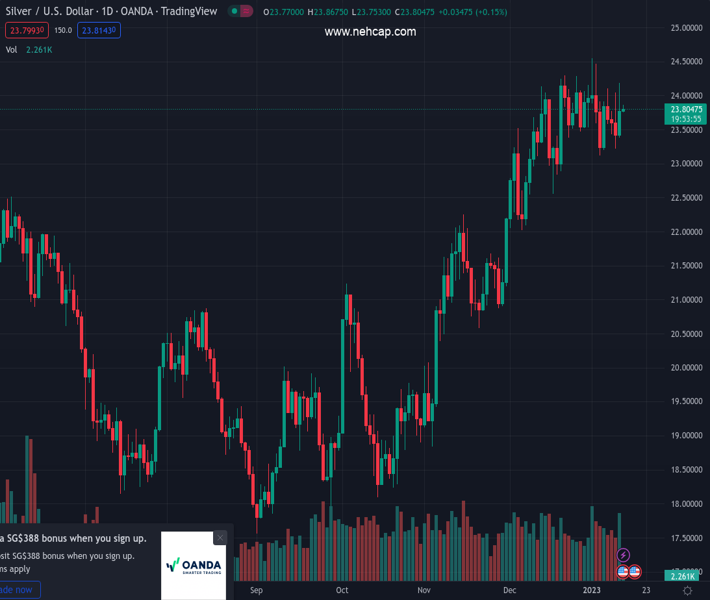
#XAGUSD @ 23.816 Silver price struggles to extend the previous day’s run-up., @nehcap view: Pullback expected (Pivot Orderbook analysis)
…
This is a premium post.
[s2If !current_user_can(access_s2member_level4)]Please register for PREMIUM VERSION HERE to read full post below containing analysis. In case of any error or you think you are not able to read the full post below, please email us at support#nehcap.com [lwa][/s2If] [s2If current_user_can(access_s2member_level4)]
- Silver price struggles to extend the previous day’s run-up.
- Convergence of 50-HMA, two-day-old support line restricts immediate downside.
- Sluggish oscillators and failure to cross weekly resistance lure XAG/USD bears.
The pair currently trades last at 23.816.
The previous day high was 24.18 while the previous day low was 23.38. The daily 38.2% Fib levels comes at 23.88, expected to provide resistance. Similarly, the daily 61.8% fib level is at 23.69, expected to provide support.
Silver price (XAG/USD) stays defensive around $23.80, after rising the most in a week, as buyers fail to defend the first daily gains in a week below the short-term key resistance line.
In addition to the failure to cross the downward-sloping resistance line from January 03, sluggish MACD signals and steady RSI (14) also back the latest pullback in the bright metal price.
However, the 50-Hour Moving Average (HMA) joins an upward-sloping support line from Wednesday to highlight the $23.70 as the short-term key support that can restrict the metal’s further declines.
Following that, the monthly low of around $23.10 and the $23.00 round figure could probe the Silver sellers.
It’s worth noting that the XAG/USD weakness past $23.00 won’t hesitate to challenge the mid-December low of $22.55 before highlighting the last defense of the buyers, namely the November 2022 peak of $22.25.
On the contrary, a one-week-old descending trend line, around $23.90 by the press time, precedes the $24.00 round figure to restrict short-term XAG/USD upside.
In a case where the Silver price remains firmer beyond $24.00, the monthly high and tops marked during January 2022, respectively near $24.55 and $24.70, will be crucial to watch as they hold the key to the metal’s rally towards April 2022 high near $26.25.
Trend: Pullback expected
Technical Levels: Supports and Resistances
XAGUSD currently trading at 23.82 at the time of writing. Pair opened at 23.78 and is trading with a change of 0.17% % .
| Overview | Overview.1 | |
|---|---|---|
| 0 | Today last price | 23.82 |
| 1 | Today Daily Change | 0.04 |
| 2 | Today Daily Change % | 0.17% |
| 3 | Today daily open | 23.78 |
The pair remains strongly bullish on the daily timeframe. It trades above its 20 SMA @ 23.7, 50 SMA 22.65, 100 SMA @ 20.89 and 200 SMA @ 21.08.
| Trends | Trends.1 | |
|---|---|---|
| 0 | Daily SMA20 | 23.70 |
| 1 | Daily SMA50 | 22.65 |
| 2 | Daily SMA100 | 20.89 |
| 3 | Daily SMA200 | 21.08 |
The previous day high was 24.18 while the previous day low was 23.38. The daily 38.2% Fib levels comes at 23.88, expected to provide resistance. Similarly, the daily 61.8% fib level is at 23.69, expected to provide support.
Note the levels of interest below:
- Pivot support is noted at 23.38, 22.99, 22.59
- Pivot resistance is noted at 24.18, 24.58, 24.98
| Levels | Levels.1 |
|---|---|
| Previous Daily High | 24.18 |
| Previous Daily Low | 23.38 |
| Previous Weekly High | 24.55 |
| Previous Weekly Low | 23.12 |
| Previous Monthly High | 24.30 |
| Previous Monthly Low | 22.03 |
| Daily Fibonacci 38.2% | 23.88 |
| Daily Fibonacci 61.8% | 23.69 |
| Daily Pivot Point S1 | 23.38 |
| Daily Pivot Point S2 | 22.99 |
| Daily Pivot Point S3 | 22.59 |
| Daily Pivot Point R1 | 24.18 |
| Daily Pivot Point R2 | 24.58 |
| Daily Pivot Point R3 | 24.98 |
[/s2If]
Join Our Telegram Group
")


