#USDCHF @ 0.92803 picks up bids to consolidate the previous day’s losses even if bulls lack upside momentum. (Pivot Orderbook analysis)
…
This is a premium post.
[s2If !current_user_can(access_s2member_level4)]Please register for PREMIUM VERSION HERE to read full post below containing analysis. In case of any error or you think you are not able to read the full post below, please email us at support#nehcap.com [lwa][/s2If] [s2If current_user_can(access_s2member_level4)]
- USD/CHF picks up bids to consolidate the previous day’s losses even if bulls lack upside momentum.
- Fed policymakers’ hesitance in backing pivot calls, despite favoring easy rate hikes, trigger US Treasury yield rebound.
- More clues for US inflation eyed for confirmation of bearish bias.
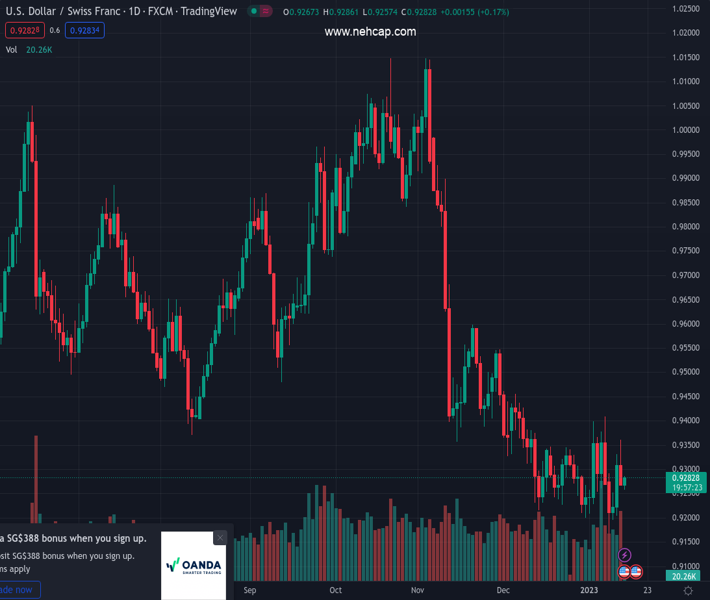
The pair currently trades last at 0.92803.
The previous day high was 0.9363 while the previous day low was 0.9266. The daily 38.2% Fib levels comes at 0.9303, expected to provide resistance. Similarly, the daily 61.8% fib level is at 0.9326, expected to provide resistance.
USD/CHF adds to the weekly gains around 0.9285, despite previous slump to a 10-month low, as traders await more clues to confirm the dovish bias from the Federal Reserve (Fed). Also likely to have probed the Swiss Franc (CHF) bears could be the latest chatters surrounding the US-China ties and a light calendar.
Recently, Atlanta Federal Reserve Bank President Raphael Bostic mentioned that he would be comfortable moving at 25 basis points if conversations with business leaders are consistent with slowing inflation. Fed’s Bostic previously stated that it is ”fair to say that the Fed is willing to overshoot.” Even so, the policymaker refrained from backing the talks that the Fed will stop rate hikes in 2023.
The same could be witnessed in the previous comments from Federal Reserve Bank of Philadelphia President Patrick Harker and Richmond Federal Reserve President Thomas Barkin. On the contrary, St. Louis Federal Reserve leader James Bullard also said that the most likely scenario is inflation remaining above 2%, so the policy rate will need to be higher for longer.
It’s worth noting that headlines suggesting fresh US-China tussles also underpinned the USD/CHF consolidation during a sluggish session. That said, Reuters cites anonymous sources to state that the White House will discuss a recent crackdown on exports of chip-making tools to China with Japanese and Dutch officials during upcoming visits. The news also mentions that the White House Officials will not result in “immediate” pledges from the two countries to impose similar curbs.
While portraying the market’s mood, the S&P 500 Futures print mild losses even if Wall Street closed with gains while the US 10-year Treasury yields lick their wounds near 3.46% by the press time, following a slump to the monthly low of 3.44% the previous day.
It should be observed that the US Dollar slumped after the US Consumer Price Index (CPI) matched 6.5% YoY forecasts for December, versus 7.1% prior. More importantly, CPI ex Food & Energy also proved the market consensus of 5.7% YoY figure right, compared to 6.0% previous readings. It’s worth noting that the CPI MoM marked the first negative figure since June 2020 while marking a -0.1% figure for the stated month, versus 0.0% forecast and 0.1% prior.
That said, the recent short-covering appears elusive ahead of China trade numbers for December and the first prints of the US Michigan Consumer Sentiment Index (CSI) for January, as well as the 5-year US Consumer Inflation Expectations.
A daily closing beyond the seven-week-old resistance line, around 0.9325 by the press time, becomes necessary for the USD/CHF bulls to retake control.
Technical Levels: Supports and Resistances
USDCHF currently trading at 0.928 at the time of writing. Pair opened at 0.928 and is trading with a change of 0.00% % .
| Overview | Overview.1 | |
|---|---|---|
| 0 | Today last price | 0.928 |
| 1 | Today Daily Change | 0.0000 |
| 2 | Today Daily Change % | 0.00% |
| 3 | Today daily open | 0.928 |
The pair remains strongly bearish on the daily time frame. It trades below the 20 SMA @ 0.929, 50 SMA 0.9411, 100 SMA @ 0.9628 and 200 SMA @ 0.9644.
| Trends | Trends.1 | |
|---|---|---|
| 0 | Daily SMA20 | 0.9290 |
| 1 | Daily SMA50 | 0.9411 |
| 2 | Daily SMA100 | 0.9628 |
| 3 | Daily SMA200 | 0.9644 |
The previous day high was 0.9363 while the previous day low was 0.9266. The daily 38.2% Fib levels comes at 0.9303, expected to provide resistance. Similarly, the daily 61.8% fib level is at 0.9326, expected to provide resistance.
Note the levels of interest below:
- Pivot support is noted at 0.9243, 0.9206, 0.9147
- Pivot resistance is noted at 0.934, 0.9399, 0.9436
| Levels | Levels.1 |
|---|---|
| Previous Daily High | 0.9363 |
| Previous Daily Low | 0.9266 |
| Previous Weekly High | 0.9410 |
| Previous Weekly Low | 0.9223 |
| Previous Monthly High | 0.9471 |
| Previous Monthly Low | 0.9201 |
| Daily Fibonacci 38.2% | 0.9303 |
| Daily Fibonacci 61.8% | 0.9326 |
| Daily Pivot Point S1 | 0.9243 |
| Daily Pivot Point S2 | 0.9206 |
| Daily Pivot Point S3 | 0.9147 |
| Daily Pivot Point R1 | 0.9340 |
| Daily Pivot Point R2 | 0.9399 |
| Daily Pivot Point R3 | 0.9436 |
[/s2If]
Join Our Telegram Group
")


