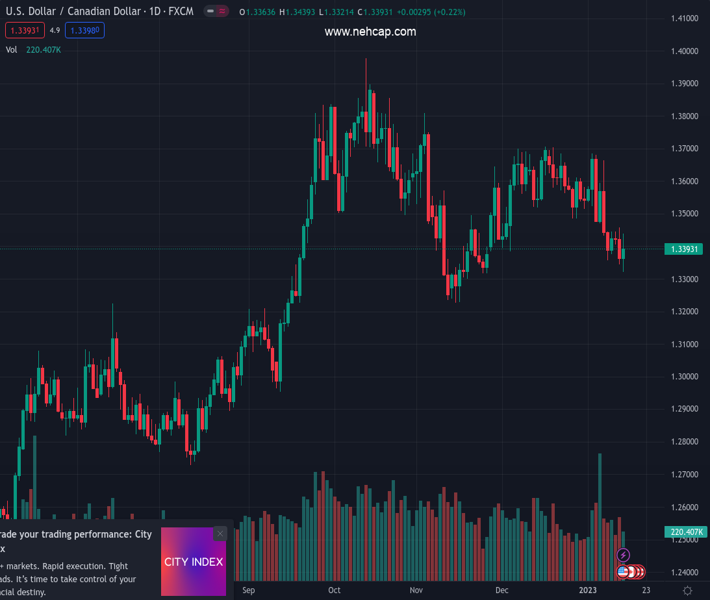
#USDCAD @ 1.33953 finished Friday’s session with gains, though it faltered to clear 1.3400. (Pivot Orderbook analysis)
…
This is a premium post.
[s2If !current_user_can(access_s2member_level4)]Please register for PREMIUM VERSION HERE to read full post below containing analysis. In case of any error or you think you are not able to read the full post below, please email us at support#nehcap.com [lwa][/s2If] [s2If current_user_can(access_s2member_level4)]
- USD/CAD finished Friday’s session with gains, though it faltered to clear 1.3400.
- USD/CAD Price Analysis: Exposed to selling pressure below 1.3400.
The pair currently trades last at 1.33953.
The previous day high was 1.3461 while the previous day low was 1.3345. The daily 38.2% Fib levels comes at 1.339, expected to provide support. Similarly, the daily 61.8% fib level is at 1.3417, expected to provide resistance.
The USD/CAD prolonged its weekly losses and tumbled for the fourth consecutive week, losing 0.36%, but on the day, the USD/CAD is up 0.22%. After the University of Michigan (UoM) Consumer Sentiment release showed that sentiment improved, it weighed on the US Dollar (USD). Therefore, the USD/CAD is trading at 1.3393, below its opening price by 0.37%.
Once the USD/CAD dropped below the 100-day Exponential Moving Average (EMA) at 1.3425, it was the seller’s excuse to drag the exchange rate below the 1.3400 mark. The Relative Strength Index (RSI) is still in bearish territory, suggesting that sellers are in charge. The Rate of Change (RoC) shows sellers are gathering momentum, as they outweighed buyers in Friday’s session, though it wasn’t enough to keep the pair in the green.
The USD/CAD first support level would be the November 24 daily low of 1.3316. A breach of the latter will expose the 200-day Exponential Moving Average (EMA) at 1.3239, followed by the 1.3200 figure.
On the other hand, the USD/CAD first resistance would be 1.3400. Once cleared, the bear’s next line of defense would be the 100-day EMA at 1.3425, ahead of the confluence of the 20-day EMA and the 1.3500 mark.
Technical Levels: Supports and Resistances
USDCAD currently trading at 1.3392 at the time of writing. Pair opened at 1.3362 and is trading with a change of 0.22 % .
| Overview | Overview.1 | |
|---|---|---|
| 0 | Today last price | 1.3392 |
| 1 | Today Daily Change | 0.0030 |
| 2 | Today Daily Change % | 0.2200 |
| 3 | Today daily open | 1.3362 |
The pair is trading below its 20 Daily moving average @ 1.3549, below its 50 Daily moving average @ 1.35 , below its 100 Daily moving average @ 1.3493 and above its 200 Daily moving average @ 1.3165
| Trends | Trends.1 | |
|---|---|---|
| 0 | Daily SMA20 | 1.3549 |
| 1 | Daily SMA50 | 1.3500 |
| 2 | Daily SMA100 | 1.3493 |
| 3 | Daily SMA200 | 1.3165 |
The previous day high was 1.3461 while the previous day low was 1.3345. The daily 38.2% Fib levels comes at 1.339, expected to provide support. Similarly, the daily 61.8% fib level is at 1.3417, expected to provide resistance.
Note the levels of interest below:
- Pivot support is noted at 1.3318, 1.3274, 1.3202
- Pivot resistance is noted at 1.3434, 1.3506, 1.355
| Levels | Levels.1 |
|---|---|
| Previous Daily High | 1.3461 |
| Previous Daily Low | 1.3345 |
| Previous Weekly High | 1.3685 |
| Previous Weekly Low | 1.3433 |
| Previous Monthly High | 1.3705 |
| Previous Monthly Low | 1.3385 |
| Daily Fibonacci 38.2% | 1.3390 |
| Daily Fibonacci 61.8% | 1.3417 |
| Daily Pivot Point S1 | 1.3318 |
| Daily Pivot Point S2 | 1.3274 |
| Daily Pivot Point S3 | 1.3202 |
| Daily Pivot Point R1 | 1.3434 |
| Daily Pivot Point R2 | 1.3506 |
| Daily Pivot Point R3 | 1.3550 |
[/s2If]
Join Our Telegram Group
")


