#USDCAD @ 1.33872 has picked strength amid caution in the market mood, however the overall sentiment is still positive. (Pivot Orderbook analysis)
…
This is a premium post.
[s2If !current_user_can(access_s2member_level4)]Please register for PREMIUM VERSION HERE to read full post below containing analysis. In case of any error or you think you are not able to read the full post below, please email us at support#nehcap.com [lwa][/s2If] [s2If current_user_can(access_s2member_level4)]
- USD/CAD has picked strength amid caution in the market mood, however the overall sentiment is still positive.
- Federal Reserve is likely to trim the pace of policy tightening due to a downward trend in US inflation.
- A sheer recovery in oil prices led by expectations of economic recovery in China may strengthen the Canadian Dollar.
- USD/CAD is likely to continue its downside journey toward the horizontal support plotted at 1.3226.
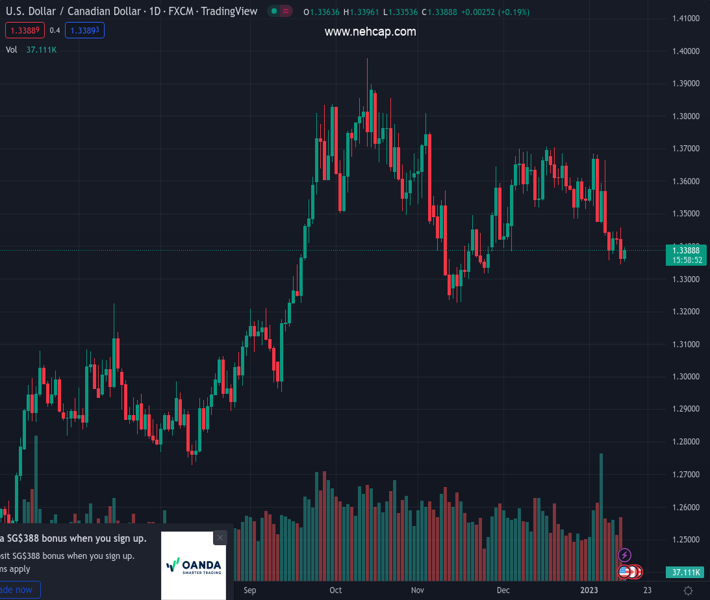
The pair currently trades last at 1.33872.
The previous day high was 1.3461 while the previous day low was 1.3345. The daily 38.2% Fib levels comes at 1.339, expected to provide resistance. Similarly, the daily 61.8% fib level is at 1.3417, expected to provide resistance.
USD/CAD has picked strength and has extended its recovery to near the round-level resistance of 1.3400 in the early European session. Earlier, the Loonie asset picked up demand after dropping to near 1.3345 as the risk appetite of the market participants dropped. Investors trimmed their longs in risk-sensitive assets after a stretched rally.
The S&P500 futures have sensed selling pressure after remaining extremely bullish consecutively in the past three trading sessions, portraying caution in the overall positive market mood. A decline in the risk appetite has also impacted the demand for US government bonds, which has increased the 10-year US Treasury yields to 3.47%. The US Dollar Index (DXY) has turned sideways below 102.00 after registering a fresh seven-month low at 101.65.
Thursday’s release of the United States Consumer Price Index (CPI) has provided confidence that the price pressures are softening and the Federal Reserve (Fed)’s blueprint of achieving price stability is operating effectively. From a peak of 9.1%, the annual headline price index has dropped to 6.5% in a few months. Thanks to the declining gasoline and used car prices have decelerated the pace of inflation in the United States economy.
A meaningful decline in the US price index has triggered odds of further deceleration in the pace of the interest rate hike already after slowing in December’s monetary policy meeting as Federal Reserve chair Jerome Powell and his teammates are working in the right direction. Philadelphia Fed Bank President Patrick Harker said on Thursday that it was time for future Fed rate hikes to shift to 25 basis points (bps) increments, as reported by Reuters.
The equity domain in the United States economy witnessed an intense sell-off in CY2022 as the Federal Reserve was on a trip of hiking interest rates to achieve the 2% inflation target. The US central bank hiked the borrowing rates with four 75 basis points (bps), two 50 bps, and one 25 bps rate hike announcements to 4.25-4.50%. As inflation is getting under control gradually and the Federal Reserve won’t be so hard on interest rates, it looks like the S&P500 will get back into the picture.
The slowdown in the pace of the interest rate hike will allow firms to achieve a sense of optimism, which will support them in executing expansion plans and boosting operations. No doubt, the pace of policy tightening will be trimmed but short-term pain will stay. Philadelphia Fed Bank President Patrick Harker cited that recession in the United States economy is not into the picture but the Gross Domestic Product (GDP) could slow to 1% this year.
After a perpendicular rally led by support from recovery in the Chinese economy led by sheer reopening measures and expectations of further sanctioning on Russia, oil prices are facing a halt around $79.00. Moscow is expected to face further sanctions from Western countries for oil supply as nations want to restrict it from getting liquidity to fund arms and ammunition in its fight against Ukraine.
Further upside in the oil price looks likely amid a decline in US inflation, which will trim the policy tightening pace of the Fed. Meanwhile, the United States administration has denied oil supply to China from its Strategic Petroleum Reserve (SPR). This will force the Chinese economy to look for alternative suppliers, which could accelerate oil prices in a short span of time.
It is worth noting that Canada is a leading exporter of oil to the United States and higher oil prices will strengthen the Canadian Dollar.
USD/CAD has delivered a breakdown of inventory distribution placed in a range of 1.3500-1.3700 on a four-hour scale. A breakdown of the inventory distribution phase results in extreme volatility expansion which triggers wider ticks to the downside. The Lonnie asset is likely to find a cushion around the horizontal support plotted from November 15 low at 1.3226.
Meanwhile, downward-sloping 20-and 50-period Exponential Moving Averages (EMAs) at 1.3414 and 1.3460 respectively, add to the downside filters.
A bearish momentum will be triggered if the Relative Strength Index (RSI) (14) will slip into the bearish range of 20.00-40.00.
Technical Levels: Supports and Resistances
USDCAD currently trading at 1.3391 at the time of writing. Pair opened at 1.3362 and is trading with a change of 0.22 % .
| Overview | Overview.1 | |
|---|---|---|
| 0 | Today last price | 1.3391 |
| 1 | Today Daily Change | 0.0029 |
| 2 | Today Daily Change % | 0.2200 |
| 3 | Today daily open | 1.3362 |
The pair is trading below its 20 Daily moving average @ 1.3549, below its 50 Daily moving average @ 1.35 , below its 100 Daily moving average @ 1.3493 and above its 200 Daily moving average @ 1.3165
| Trends | Trends.1 | |
|---|---|---|
| 0 | Daily SMA20 | 1.3549 |
| 1 | Daily SMA50 | 1.3500 |
| 2 | Daily SMA100 | 1.3493 |
| 3 | Daily SMA200 | 1.3165 |
The previous day high was 1.3461 while the previous day low was 1.3345. The daily 38.2% Fib levels comes at 1.339, expected to provide resistance. Similarly, the daily 61.8% fib level is at 1.3417, expected to provide resistance.
Note the levels of interest below:
- Pivot support is noted at 1.3318, 1.3274, 1.3202
- Pivot resistance is noted at 1.3434, 1.3506, 1.355
| Levels | Levels.1 |
|---|---|
| Previous Daily High | 1.3461 |
| Previous Daily Low | 1.3345 |
| Previous Weekly High | 1.3685 |
| Previous Weekly Low | 1.3433 |
| Previous Monthly High | 1.3705 |
| Previous Monthly Low | 1.3385 |
| Daily Fibonacci 38.2% | 1.3390 |
| Daily Fibonacci 61.8% | 1.3417 |
| Daily Pivot Point S1 | 1.3318 |
| Daily Pivot Point S2 | 1.3274 |
| Daily Pivot Point S3 | 1.3202 |
| Daily Pivot Point R1 | 1.3434 |
| Daily Pivot Point R2 | 1.3506 |
| Daily Pivot Point R3 | 1.3550 |
[/s2If]
Join Our Telegram Group
")


