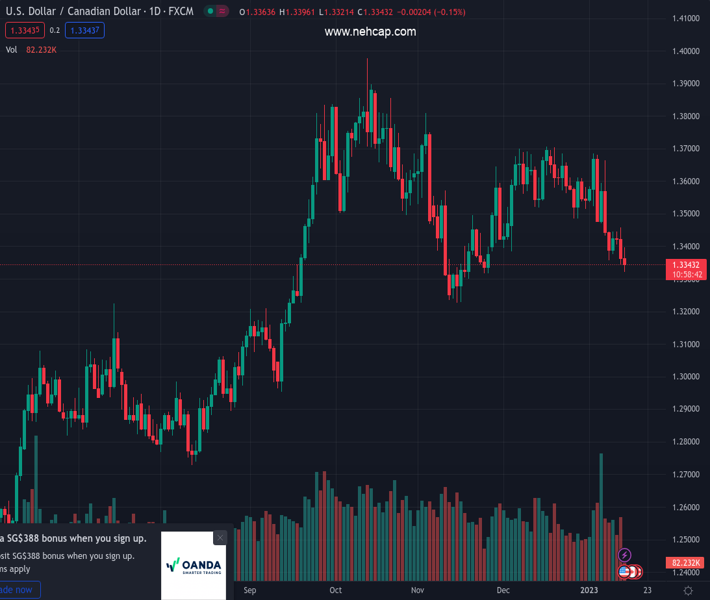
#USDCAD @ 1.33431 drops to its lowest level since November and is pressured by a combination of factors. (Pivot Orderbook analysis)
…
This is a premium post.
[s2If !current_user_can(access_s2member_level4)]Please register for PREMIUM VERSION HERE to read full post below containing analysis. In case of any error or you think you are not able to read the full post below, please email us at support#nehcap.com [lwa][/s2If] [s2If current_user_can(access_s2member_level4)]
- USD/CAD drops to its lowest level since November and is pressured by a combination of factors.
- Bullish oil prices underpin the Loonie and act as a headwind amid the prevalent USD selling bias.
- The fundamental backdrop favours bearish traders and supports prospects for additional losses.
The pair currently trades last at 1.33431.
The previous day high was 1.3461 while the previous day low was 1.3345. The daily 38.2% Fib levels comes at 1.339, expected to provide resistance. Similarly, the daily 61.8% fib level is at 1.3417, expected to provide resistance.
The USD/CAD pair attracts fresh sellers in the vicinity of the 1.3400 mark on Friday and drops to its lowest level since November 25 during the first half of the European session. The pair is currently placed just below mid-1.3300s, down around 0.15% for the day, and is pressured by a combination of factors.
Crude oil prices trade with modest gains near a one-and-half-week high amid hopes that China’s pivot away from its zero-COVID policy will boost fuel demand. This, in turn, is seen underpinning the commodity-linked Loonie, which, along with the prevalent US Dollar selling bias, drags the USD/CAD pair lower for the second straight day.
The USD Index, which measures the greenback’s performance against a basket of currencies, languishes near a seven-month low amid expectations that the Fed will soften its hawkish tone. The bets for smaller Fed rate hikes were lifted by the US consumer inflation figures and comments by several FOMC officials on Thursday.
In fact, the markets now seem convinced that the Fed will further slow the pace of its rate-hiking cycle and deliver a smaller 25 bps lift-off in February. This, in turn, keeps the US Treasury bond yields depressed near a multi-week low, which, along with a positive risk tone, continues to weigh on the safe-haven greenback.
Traders now look to the US economic docket, featuring the release of the Preliminary Michigan Consumer Sentiment Index later during the early North American session. This, along with oil price dynamics, could provide some impetus to the USD/CAD pair. Nevertheless, spot prices remain on track to end in the red for the fourth straight week.
Technical Levels: Supports and Resistances
USDCAD currently trading at 1.3338 at the time of writing. Pair opened at 1.3362 and is trading with a change of -0.18 % .
| Overview | Overview.1 | |
|---|---|---|
| 0 | Today last price | 1.3338 |
| 1 | Today Daily Change | -0.0024 |
| 2 | Today Daily Change % | -0.1800 |
| 3 | Today daily open | 1.3362 |
The pair is trading below its 20 Daily moving average @ 1.3549, below its 50 Daily moving average @ 1.35 , below its 100 Daily moving average @ 1.3493 and above its 200 Daily moving average @ 1.3165
| Trends | Trends.1 | |
|---|---|---|
| 0 | Daily SMA20 | 1.3549 |
| 1 | Daily SMA50 | 1.3500 |
| 2 | Daily SMA100 | 1.3493 |
| 3 | Daily SMA200 | 1.3165 |
The previous day high was 1.3461 while the previous day low was 1.3345. The daily 38.2% Fib levels comes at 1.339, expected to provide resistance. Similarly, the daily 61.8% fib level is at 1.3417, expected to provide resistance.
Note the levels of interest below:
- Pivot support is noted at 1.3318, 1.3274, 1.3202
- Pivot resistance is noted at 1.3434, 1.3506, 1.355
| Levels | Levels.1 |
|---|---|
| Previous Daily High | 1.3461 |
| Previous Daily Low | 1.3345 |
| Previous Weekly High | 1.3685 |
| Previous Weekly Low | 1.3433 |
| Previous Monthly High | 1.3705 |
| Previous Monthly Low | 1.3385 |
| Daily Fibonacci 38.2% | 1.3390 |
| Daily Fibonacci 61.8% | 1.3417 |
| Daily Pivot Point S1 | 1.3318 |
| Daily Pivot Point S2 | 1.3274 |
| Daily Pivot Point S3 | 1.3202 |
| Daily Pivot Point R1 | 1.3434 |
| Daily Pivot Point R2 | 1.3506 |
| Daily Pivot Point R3 | 1.3550 |
[/s2If]
Join Our Telegram Group
")


