The index manages to regain some poise near 102.00. (Pivot Orderbook analysis)
…
This is a premium post.
[s2If !current_user_can(access_s2member_level4)]Please register for PREMIUM VERSION HERE to read full post below containing analysis. In case of any error or you think you are not able to read the full post below, please email us at support#nehcap.com [lwa][/s2If] [s2If current_user_can(access_s2member_level4)]
- The index manages to regain some poise near 102.00.
- Further losses remain on the cards below 102.00.
The pair currently trades last at 102.45.
The previous day high was 103.31 while the previous day low was 102.07. The daily 38.2% Fib levels comes at 102.55, expected to provide resistance. Similarly, the daily 61.8% fib level is at 102.84, expected to provide resistance.
Finally, some respite for the dollar sees the index pick up some upside traction and leave the area of recent lows near the 102.00 yardstick on Friday.
In case bears regain the upper hand, the loss of the January low at 101.98 (January 13) should put a potential deeper drop to the May 2022 low around 101.30 (May 30) back on the investors’ radar prior to the psychological 100.00 level.
In the meantime, while below the 200-day SMA at 106.39 the outlook for DXY should remain tilted to the negative side.
Technical Levels: Supports and Resistances
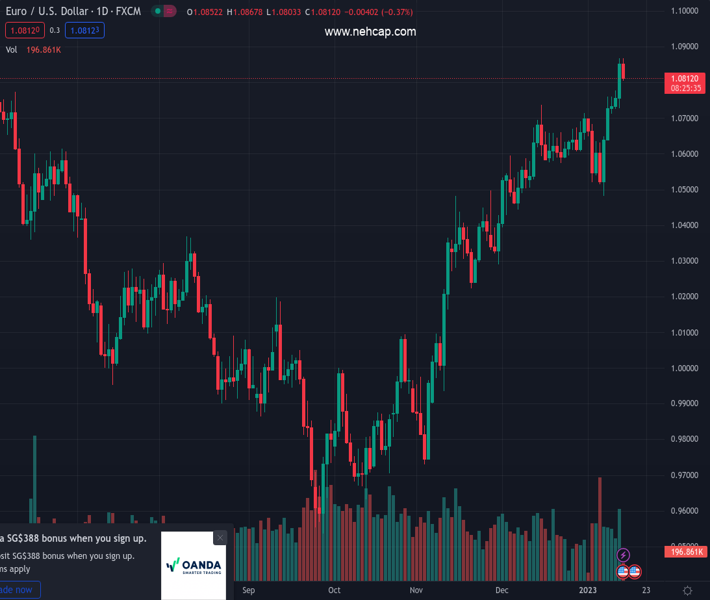
EURUSD currently trading at 102.45 at the time of writing. Pair opened at 102.25 and is trading with a change of 0.2 % .
| Overview | Overview.1 | |
|---|---|---|
| 0 | Today last price | 102.45 |
| 1 | Today Daily Change | 54.00 |
| 2 | Today Daily Change % | 0.20 |
| 3 | Today daily open | 102.25 |
The pair remains strongly bearish on the daily time frame. It trades below the 20 SMA @ 104.02, 50 SMA 105.01, 100 SMA @ 108.04 and 200 SMA @ 106.82.
| Trends | Trends.1 | |
|---|---|---|
| 0 | Daily SMA20 | 104.02 |
| 1 | Daily SMA50 | 105.01 |
| 2 | Daily SMA100 | 108.04 |
| 3 | Daily SMA200 | 106.82 |
The previous day high was 103.31 while the previous day low was 102.07. The daily 38.2% Fib levels comes at 102.55, expected to provide resistance. Similarly, the daily 61.8% fib level is at 102.84, expected to provide resistance.
Note the levels of interest below:
- Pivot support is noted at 101.78, 101.31, 100.54
- Pivot resistance is noted at 103.02, 103.79, 104.26
| Levels | Levels.1 |
|---|---|
| Previous Daily High | 103.31 |
| Previous Daily Low | 102.07 |
| Previous Weekly High | 105.63 |
| Previous Weekly Low | 103.43 |
| Previous Monthly High | 106.02 |
| Previous Monthly Low | 103.39 |
| Daily Fibonacci 38.2% | 102.55 |
| Daily Fibonacci 61.8% | 102.84 |
| Daily Pivot Point S1 | 101.78 |
| Daily Pivot Point S2 | 101.31 |
| Daily Pivot Point S3 | 100.54 |
| Daily Pivot Point R1 | 103.02 |
| Daily Pivot Point R2 | 103.79 |
| Daily Pivot Point R3 | 104.26 |
[/s2If]
Join Our Telegram Group
")


