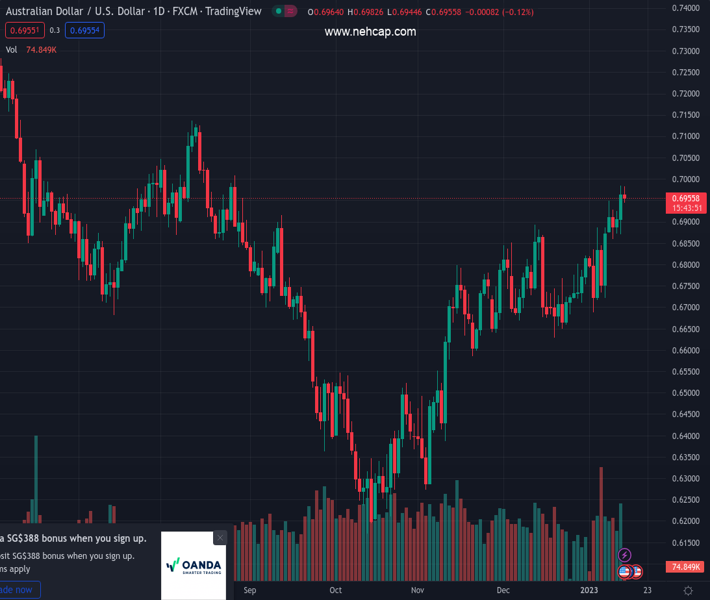
#AUDUSD @ 0.69551 retreats from a multi-month high touched on Thursday amid a modest USD uptick. (Pivot Orderbook analysis)
…
This is a premium post.
[s2If !current_user_can(access_s2member_level4)]Please register for PREMIUM VERSION HERE to read full post below containing analysis. In case of any error or you think you are not able to read the full post below, please email us at support#nehcap.com [lwa][/s2If] [s2If current_user_can(access_s2member_level4)]
- AUD/USD retreats from a multi-month high touched on Thursday amid a modest USD uptick.
- Rebounding US bond yields and a softer risk tone helps revive demand for the safe-haven buck.
- Rising bets for smaller Fed rate hikes should cap the USD and limit the downside for the major.
The pair currently trades last at 0.69551.
The previous day high was 0.6985 while the previous day low was 0.6877. The daily 38.2% Fib levels comes at 0.6944, expected to provide support. Similarly, the daily 61.8% fib level is at 0.6918, expected to provide support.
The AUD/USD pair comes under some selling pressure on Friday and erodes a part of the previous day’s strong gains to the highest level since August 26. The pair remains depressed heading into the European session and is currently placed near the daily low, around mid-0.6900s.
A combination of factors assists the US Dollar to stage a modest bounce from a seven-month low, which, in turn, acts as a headwind for the AUD/USD pair. A modest uptick in the US Treasury bond yields, along with a softer tone around the equity markets, offers some support to the greenback. The worst COVID-19 outbreak in China overshadows the optimism led by the country’s pivot away from its zero-COVID policy. Apart from this, the protracted Russia-Ukraine war has been fueling worries about a deeper global economic downturn and weighing on investors’ sentiment. This, in turn, drives some haven flows towards the buck and undermines the risk-sensitive Australian Dollar.
That said, any meaningful USD recovery still seems elusive amid rising bets for smaller Fed rate hikes going forward. Investors now seem convinced that the US central bank will soften its hawkish stance and the expectations were reaffirmed by Thursday’s release of the latest US consumer inflation figures. Furthermore, several FOMC members backed the case for a 25 bps lift-off in February, which should keep a lid on the US bond yields and hold back the USD bulls on the back foot. Apart from this, odds for an additional interest rate hike by the Reserve Bank of Australia (RBA) in February support prospects for the emergence of some dip-buying around the AUD/USD pair.
Hence, it will be prudent to wait for strong follow-through selling before confirming that the major has formed a near-term top and positioning for a deeper corrective pullback. Market participants now look forward to the release of the Preliminary Michigan Consumer Sentiment Index from the US, due later during the early North American session. This, along with the US bond yields and the broader risk sentiment, will drive the USD demand and provide some impetus to the AUD/USD pair. Nevertheless, spot prices remain on track to end in the green for the fourth successive week.
Technical Levels: Supports and Resistances
AUDUSD currently trading at 0.6953 at the time of writing. Pair opened at 0.6968 and is trading with a change of -0.22 % .
| Overview | Overview.1 | |
|---|---|---|
| 0 | Today last price | 0.6953 |
| 1 | Today Daily Change | -0.0015 |
| 2 | Today Daily Change % | -0.2200 |
| 3 | Today daily open | 0.6968 |
The pair remains strongly bullish on the daily timeframe. It trades above its 20 SMA @ 0.678, 50 SMA 0.6729, 100 SMA @ 0.6634 and 200 SMA @ 0.6834.
| Trends | Trends.1 | |
|---|---|---|
| 0 | Daily SMA20 | 0.6780 |
| 1 | Daily SMA50 | 0.6729 |
| 2 | Daily SMA100 | 0.6634 |
| 3 | Daily SMA200 | 0.6834 |
The previous day high was 0.6985 while the previous day low was 0.6877. The daily 38.2% Fib levels comes at 0.6944, expected to provide support. Similarly, the daily 61.8% fib level is at 0.6918, expected to provide support.
Note the levels of interest below:
- Pivot support is noted at 0.6902, 0.6836, 0.6794
- Pivot resistance is noted at 0.701, 0.7051, 0.7118
| Levels | Levels.1 |
|---|---|
| Previous Daily High | 0.6985 |
| Previous Daily Low | 0.6877 |
| Previous Weekly High | 0.6887 |
| Previous Weekly Low | 0.6688 |
| Previous Monthly High | 0.6893 |
| Previous Monthly Low | 0.6629 |
| Daily Fibonacci 38.2% | 0.6944 |
| Daily Fibonacci 61.8% | 0.6918 |
| Daily Pivot Point S1 | 0.6902 |
| Daily Pivot Point S2 | 0.6836 |
| Daily Pivot Point S3 | 0.6794 |
| Daily Pivot Point R1 | 0.7010 |
| Daily Pivot Point R2 | 0.7051 |
| Daily Pivot Point R3 | 0.7118 |
[/s2If]
Join Our Telegram Group
")


